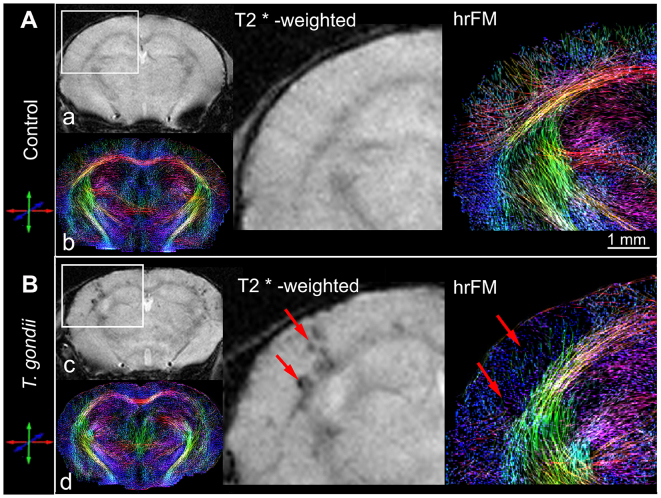
Fig. 2.
In vivo appraisal, by DT-MRI, of cortical injuries induced upon chronic T. gondii infection. Comparative visualization of T2*-weighted images (a,c) and high-resolution fiber maps (hrFM) (b,d) of control (A) and T. gondii-infected (B) mouse brains. Magnified views show the localization of T. gondii-induced injuries (arrows) in the somatosensory cortex. Note the changed cortical connectivity pattern (versus control) and the loss of fiber density in infected cortical areas. Brain connectivity maps were generated using a global optimization fiber tracking algorithm on data acquired at 9,4 Tesla. (Infected mice n=7, control mice n=9.)

