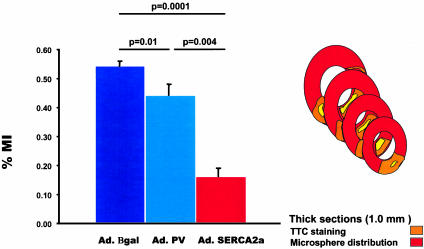
Fig. 9.
Tabulated data from the TTC staining, showing a significant reduction in the percentage of myocardial infarction (%MI) after overexpression of Ad.SERCA2a compared with Ad.PV or Ad.βgal. Inset is a drawing depicting the method of measuring %MI. Red indicates the perfused area as delineated by the fluorescent beads. Orange indicates the AAR of vital myocardium as marked by the TTC staining. Yellow indicates the infracted area of dead myocardium. The reconstruction of the total MI results from the average measurements of consecutive cuts. (SERCA, n = 4; GFP, n = 4; Sham, n = 4.)

