
Figure 1. Structural analysis of JAK2V617F kinase domain mutations.
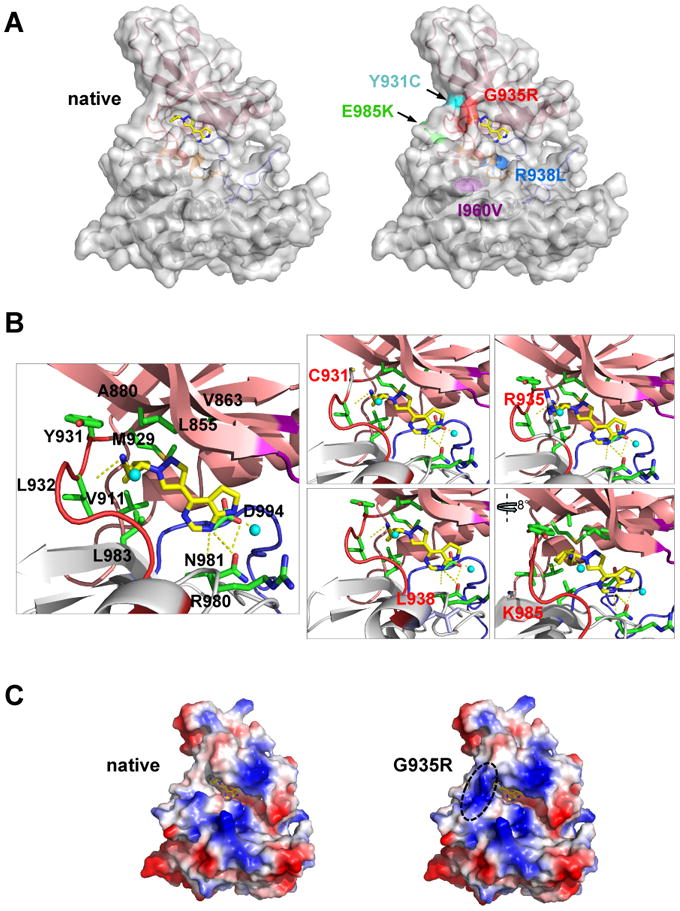
A, cartoon and transparent surface representation of ruxolitinib-docked JAK2 kinase domain (A and B) (left) and JAK2 with location of point mutations that lead to drug resistance (right). N-terminal lobe (salmon), C-terminal lobe (grey), glycine loop (purple), activation loop (blue) and hinge region (red) form the boundaries for the binding site of ruxolitinib (stick representation in yellow (carbon) and blue (nitrogen)). The I960V sidechain (purple) is buried within the protein interior. B, enlarged ruxolitinib binding pocket with secondary structure elements (cartoon) and the interactions of the sidechains (labeled sticks) with the inhibitor. Hydrogen-bonds between the inhibitor and the protein are indicated as dotted yellow lines (one hydrogen-bond between backbone of Y931 and L932; and two hydrogen-bonds with R980 and N981 and pyrrolopyrimidine ring of the inhibitor; additional hydrogen bonds are with water molecules (cyan spheres)). Mutated amino acids are labeled red (right panels). C, surface electrostatic potential representation of the native (left) and G935R (right) containing JAK2 JH1 domain with ruxolitinib. Charged surfaces are displayed in shades of blue (positive), red (negative) and white (non-polar).