
Figure 3.
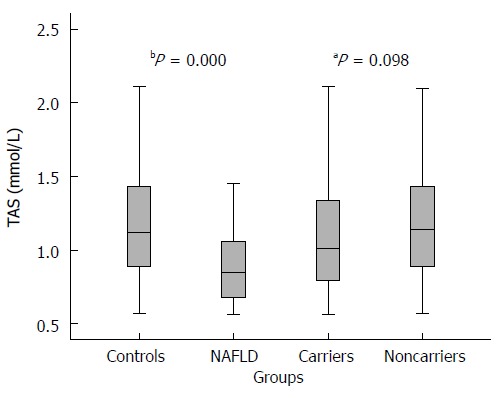
Comparison of total antioxidant status in different groups. aP and bP were tested by Student’s unpaired t test, aP = 0.098 vs carriers, bP < 0.01 vs controls, respectively. TAS: Total antioxidant status.
Official websites use .gov
A
.gov website belongs to an official
government organization in the United States.
Secure .gov websites use HTTPS
A lock (
) or https:// means you've safely
connected to the .gov website. Share sensitive
information only on official, secure websites.
Comparison of total antioxidant status in different groups. aP and bP were tested by Student’s unpaired t test, aP = 0.098 vs carriers, bP < 0.01 vs controls, respectively. TAS: Total antioxidant status.