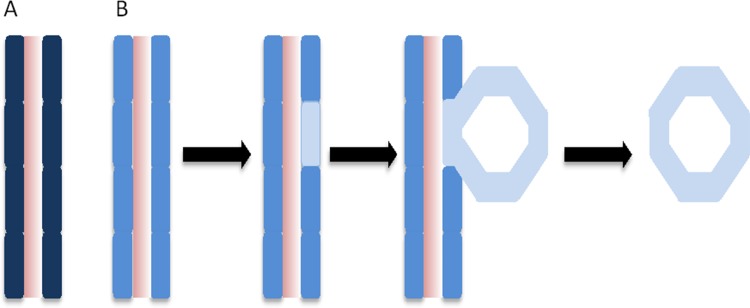
Figure 1. Depiction of gene dosage changes in kidney cyst formation in ADPKD.

A) A segment of renal tubule from a normal individual, with a normal PKD1 gene dosage as represented by the dark blue colour of each epithelial cell of the renal tubule. B) Events leading to cyst formation in a segment of renal tubule from an individual with a PKD1 mutation, associated with reduced dosage of functional PKD1 protein as represented by the lighter blue colour of each epithelial cell of the renal tubule. Within one cell of the renal tubule segment a somatic event occurs that leads to further reduced dosage levels of PKD1 protein (represented by the very pale blue colour), which then leads to cyst formation.
