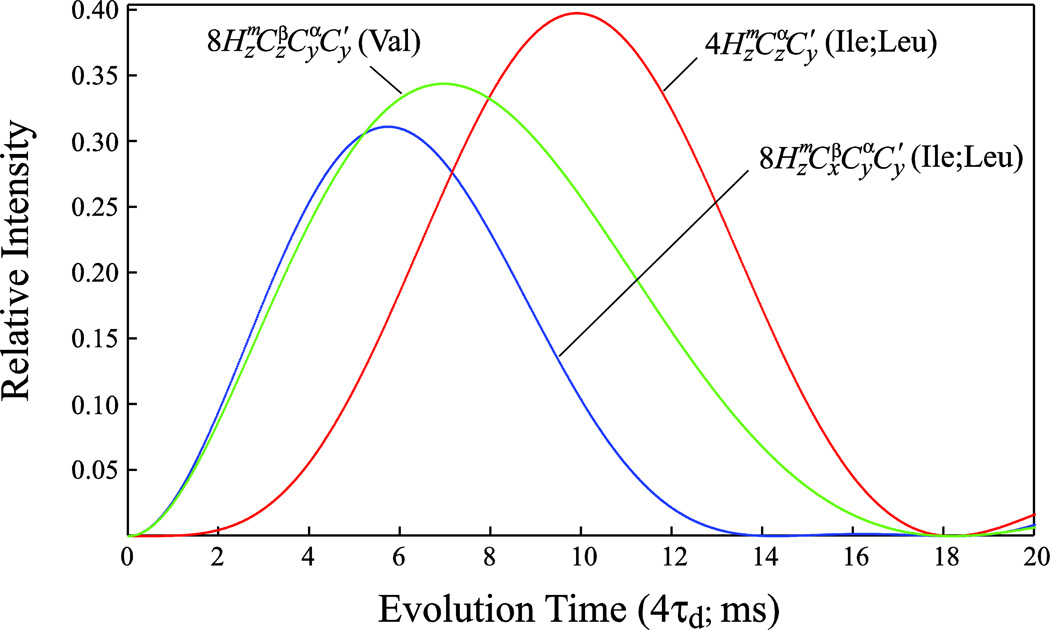
Figure 2.
Plots comparing the magnetization transfer functions for Valine methyl (1H,13C)-13CO correlations (green curve; [sin(4πτd1JCα-CO)exp(−4RCατd)exp(−4RCβτd)]2, where 1JCα-CO is the one bond 13Cα-13CO J coupling (55 Hz), and RCα and RCβ are the relaxation rates of 13Cα and 13Cβ nuclei, respectively, both assumed to be equal to 30 s−1 for deuterated EIC), and Ile/Leu methyl (1H,13C)-13CO correlations (red and blue curves corresponding to [sin(4πτd1JC1-CO)sin(4πτd1JCα-Cβ)exp(™4RCατd)]2 and [sin(4πτd1JCα-CO)cos(4πτd1JCα-Cβ)exp(−4RCατd)]2, respectively, where 1JCα-Cβ is the one bond 13Cα-13Cβ J coupling (35 Hz) and the rest of the notation defined above) as a 18 function of the delay 4τd (ms) in the SIM-HMCM(CGCBCA)CO experiment of Figure 1. Methyl (1H,13C)-13CO correlations arise from the magnetization terms indicated on the plot created at time point d and evolving during the t1 evolution period of the scheme in Figure 1.

