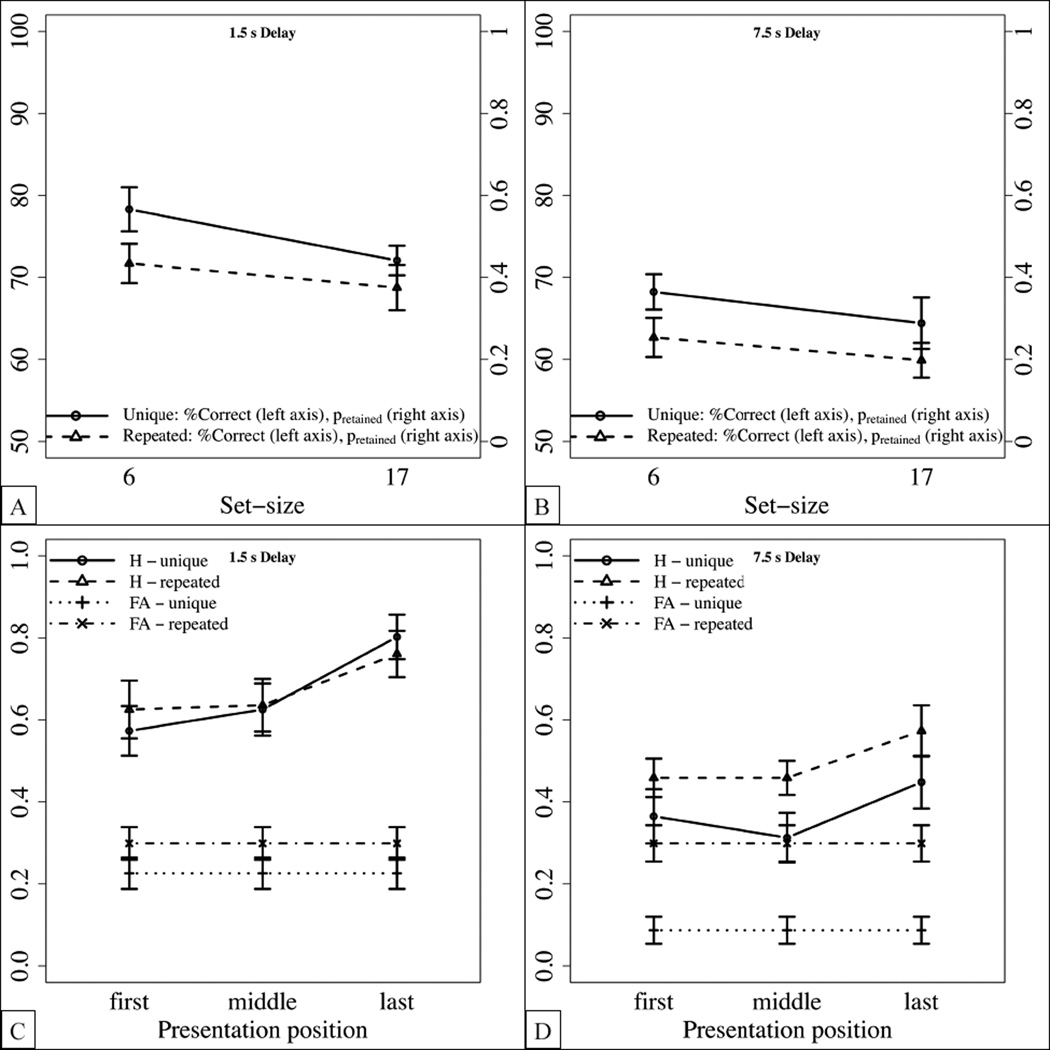
Figure 6.
Detailed results of Experiment 4. Error bars standard errors from the mean. (A,B) Percentage of correct responses and proportion of retained items after the short delay (A) and the long delay (B). (C,D) Hit rates for set-size 17 as a function of presentation positions after the short delay (C) and the long delay (D). False alarm rates are calculated for all “new” trials for set-size 17, separately for the long and the short delay, respectively.

