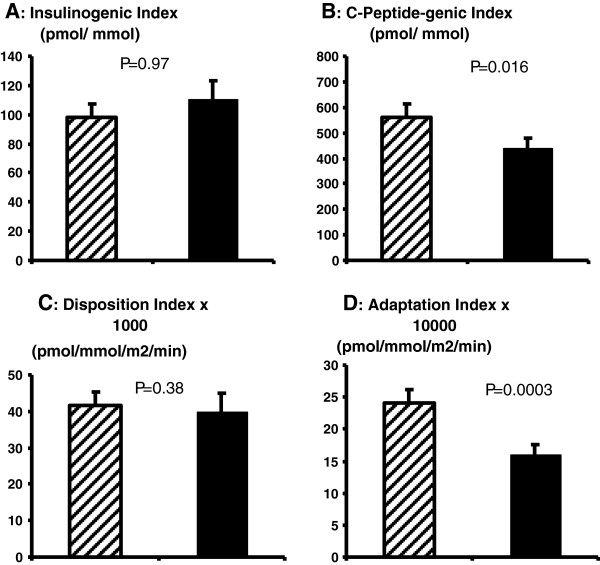
Figure 2.
(A-D): OGTT-derived indices of beta-cell function. Data are presented as means ± SEM. Dashed bars represent participants with IHL ≤ 5.5%. Solid bars represent participants with IHL > 5.5%, i.e. NAFLD. P values are derived from linear regression modelling with the exposure IHL treated as a continuous variable, adjusted for age, sex, visceral fat area and alcohol consumption.

