Fig. 1.
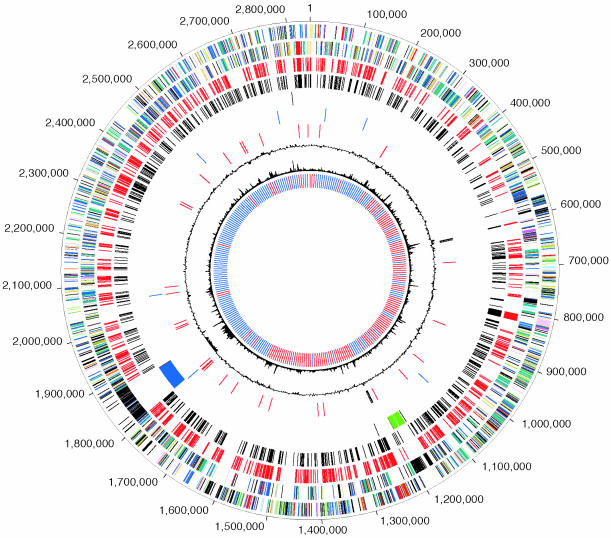
Circular representation of the T. denticola (ATCC 35405) overall genome structure. The outer scale designates coordinates in base pairs. The first circle shows predicted coding regions on the plus strand color-coded by role categories: violet, amino acid biosynthesis; light blue, biosynthesis of cofactors, prosthetic groups, and carriers; light green, cell envelope; red, cellular processes; brown, central intermediary metabolism; yellow, DNA metabolism; light gray, energy metabolism; magenta, fatty acid and phospholipid metabolism; pink, protein synthesis and fate; orange, purines, pyrimidines, nucleosides, and nucleotides; olive, regulatory functions and signal transduction; dark green, transcription; teal, transport and binding proteins; gray, unknown function; salmon, other categories; blue, hypothetical proteins. The second circle shows predicted coding regions on the minus strand color-coded by role categories. The third circle shows the core set of CDSs conserved in all other sequenced spirochete genomes. The fourth circle shows CDSs with best matches to predicted CDSs in T. pallidum. The fifth circle shows putative phage regions and isolated phage genes. The sixth circle shows IS elements in black. The seventh circle shows rRNA genes in black and tRNA genes in red. The eighth circle shows trinucleotide composition in black. The ninth circle shows percentage G + C in relation to the mean G + C in a 2,000-bp window. The 10th circle shows GC-skew curve in red (positive residues) and blue (negative residues).

