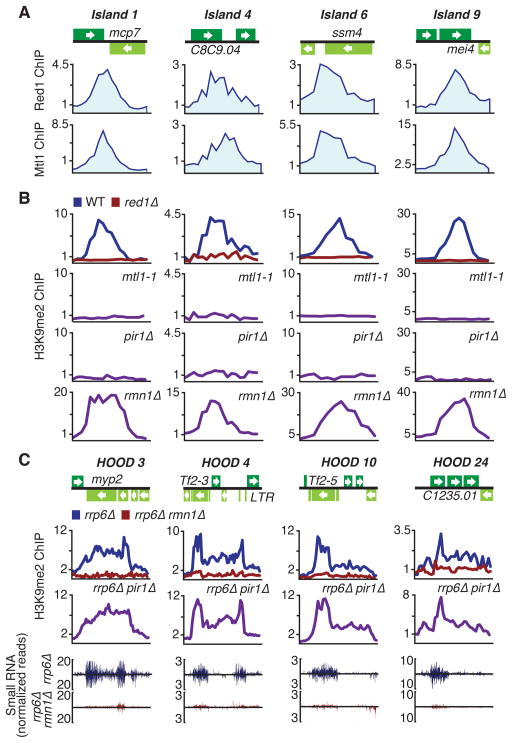
Figure 2. Red1- and Mtl1-Associated Factors Differentially Affect Heterochromatin Domains.
(A) ChIP-chip analysis of Red1-MYC and Mtl1-MYC distribution at heterochromatin island loci. (B) ChIP-chip analysis of H3K9me2 distribution at heterochromatin island loci in indicated strains. (C) ChIP-chip analysis of the effect of pir1Δ and rmn1Δ on H3K9me2 distribution at HOODs in rrp6Δ (top). Normalized number of small RNA reads plotted in alignment with HOOD loci (bottom). The signals above and below the line represent small RNAs that map to the top and bottom DNA strands, respectively. See also Figure S2 and Table S1.

