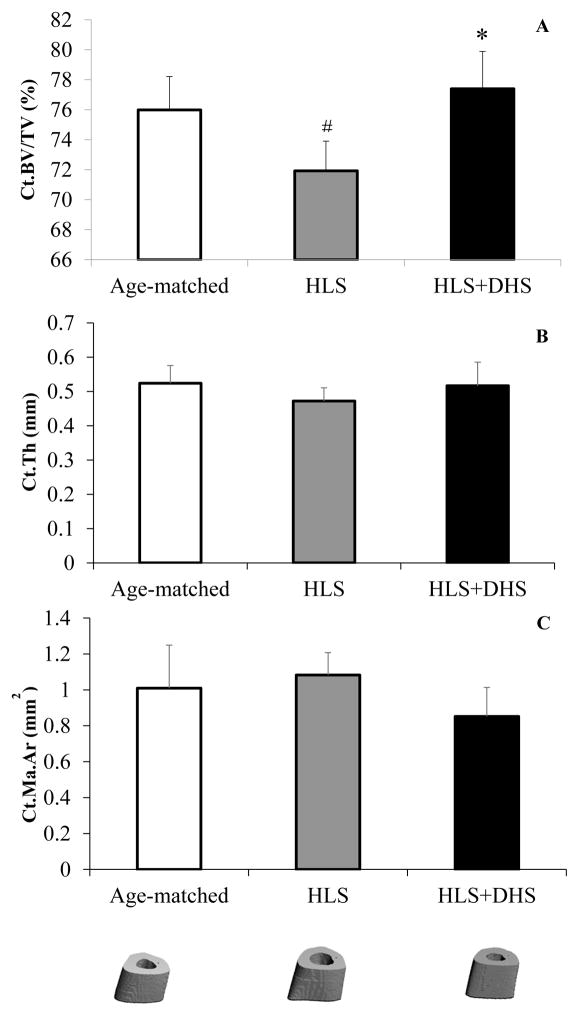
Figure 1.
Graphs show mean±SD values for A) cortical bone thickness (Cort.Th, mm), B) periosteal surface (Peri.S, mm2), C) endosteal surface (Endo.S, mm2), and representative 3D μCT images of mid-diaphyseal region of the tibiae. DHS at 2 Hz produced a significant change in Cort.Th, compared to values obtained in 4-week HLS. *p < 0.05 vs. HLS.

