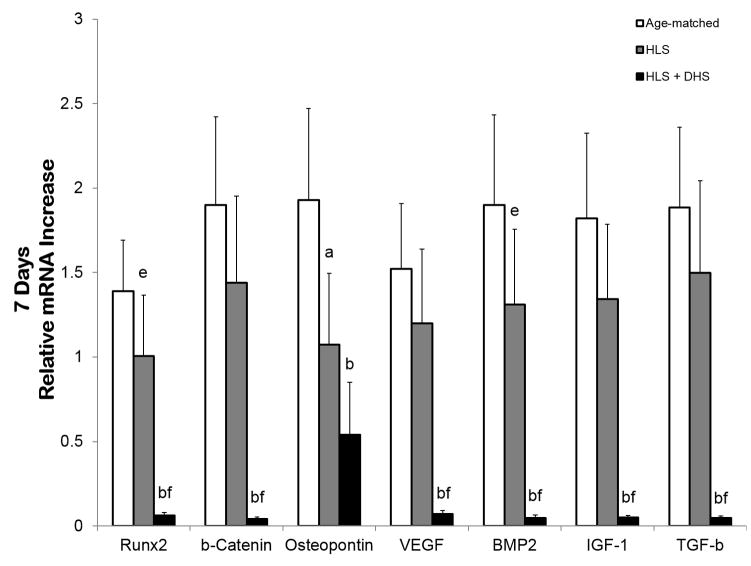
Figure 4.
Graphs show mean±SE of mRNA levels in the tibiae – day 7. The overall reduction of the mRNA levels in the HLS group compared to age-matched controls was lower than the day-3 data. Interestingly, the mRNA levels of DHS-treated group of all the selected genes remained low. ap < 0.01 vs. age-matched; bp < 0.001 vs. age-matched; cp < 0.01 vs. HLS; dp < 0.01 vs. age-matched; ep < 0.05 vs. age-matched; fp < 0.001 vs. HLS.

