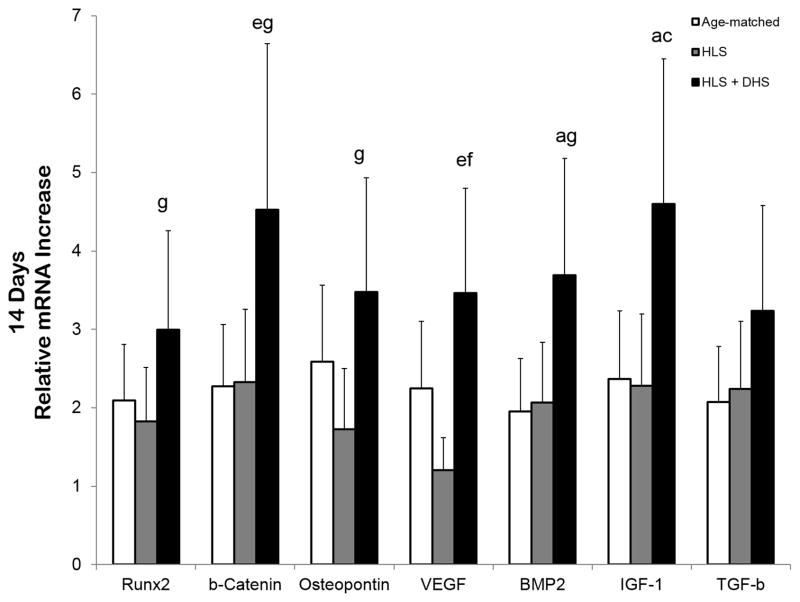
Figure 5.
Graphs show mean±SE of mRNA levels in the tibiae – day 14. The selected genes in the DHS-treated group were greatly upregulated. For instance, the fold change of the DHS-treated group was 3.0 (runx2), 4.5 (β-catenin), 3.5 (osteopontin), 3.5 (VEGF), 3.7 (BMP2), 4.6 (IGF-1), and 3.2 (TGF-β). ap < 0.01 vs. age-matched; bp < 0.001 vs. age-matched; cp < 0.01 vs. HLS; dp < 0.01 vs. age-matched; ep < 0.05 vs. age-matched; fp < 0.001 vs. HLS; gp < 0.05 vs. HLS.

