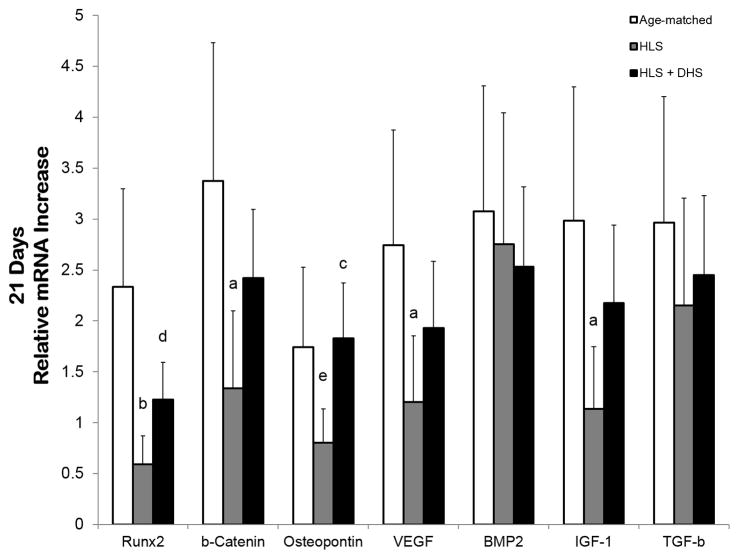
Figure 6.
Graphs show mean±SE of mRNA levels in the tibiae – day 21. The elevated mRNA levels of the DHS-treated group were slightly less pronounced compared to the day-14 data. Specifically, the DHS-driven fold change was 1.2 (RUNX2), 2.4 (β-catenin), 1.8 (osteopontin), 1.9 (VEGF), 2.5 (BMP2), 2.2 (IGF-1), and 2.4 (TGF-β). ap < 0.01 vs. age-matched; bp < 0.001 vs. age-matched; cp < 0.01 vs. HLS; dp < 0.01 vs. age-matched; ep < 0.05 vs. age-matched.

