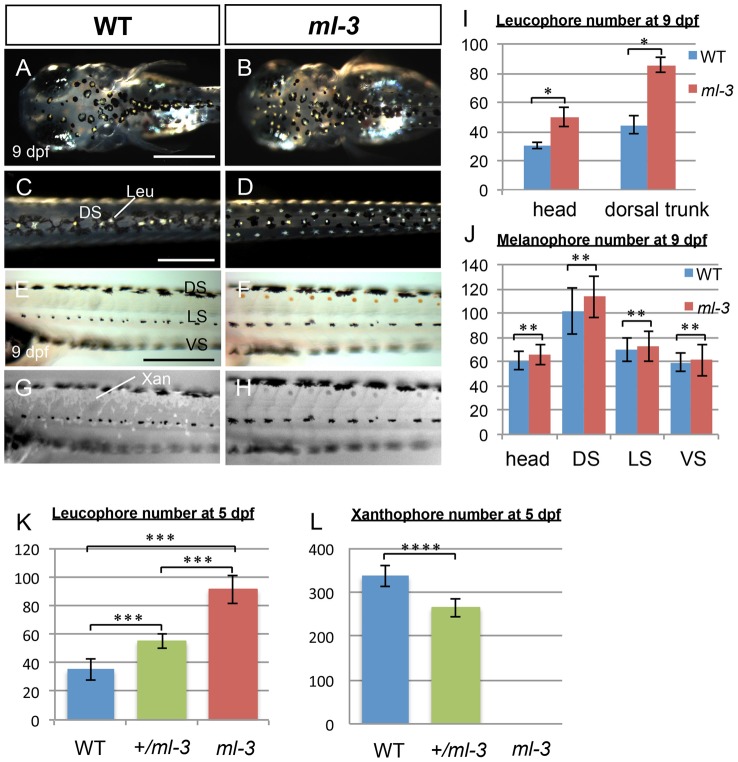
Figure 1. Larval pigment pattern phenotypes of medaka ml-3 mutants.
(A–H) 9 dpf (hatching stage). (A, C, E, G) WT. (B, D, F, H) ml-3 mutant. (E, F) Bright field. (G, H) UV light. (A–D) Dorsal views. (E–H) Lateral views. (A–D) Leucophores are formed in excess in mutants. Whereas in WT larvae leucophores lie over the head (A) and along dorsal midline of the trunk (C) in association with melanophores, in ml-3 larvae excess leucophores are localized ectopically to form bilateral lines along the anterior-posterior axis (B, D) in addition to those in the normal position in head (B) and trunk midline (D). (E–H) Xanthophores are absent from ml-3 mutants. In WT (E) as well as in ml-3 (F), xanthophores are not evident when observed in brightfield. Under UV illumination, however, auto-fluorescent xanthophores are readily visible in WT, covering over dorsal trunk (G). In ml-3 mutants, xanthophore auto-fluorescence is not detected (H). (A–H) Melanophore patterns are unaffected in ml-3 mutants. In both WT (E, G) and ml-3 mutants (F, H), melanophores are distributed in three longitudinal stripes (DS, LS and VS). (I, J) Counts of leucophores and melanophores in ml-3 mutants at 9 dpf. Mean counts (error bars give standard deviation) are shown for WT (blue) and ml-3 mutants (red). (I) The numbers of leucophores in head region and in dorsal trunk are larger in ml-3 than in WT (n = 12 for each group and region): two-way ANOVA, F(group) = 389.09, df = 1,42, p<0.0001; F(group×region) = 46.93, df = 1,42, p<0.0001 and Student's t-test for each region, *, p<0.0001. (J) There is no significant difference in melanophore number between WT and ml-3 (n = 12 for WT, n = 11 for ml-3): two-way ANOVA, F(group) = 3.72, df = 1,88, p>0.05; F(group×region) = 0.74, df = 1,88, p>0.05 and Student's t-test for each region, **, p>0.05. (K, L) Mean (±s.d.) counts of leucophores and xanthophores on dorsal trunk surface in WT, ml-3 heterozygotes (+/ml-3) and ml-3 homozygotes (ml-3) at 5 dpf (also see Figures S2E–S2J). (K) The leucophore numbers seem to be negatively correlated with the copy-number of ml-3 gene (n = 10 for each group). p<0.0001 by one-way ANOVA. ***, p<0.0001 by Student's t-test for WT versus ml-3 heterozygotes, WT versus ml-3 homozygotes, and ml-3 heterozygotes versus homozygotes. (L) The xanthophore numbers seem to be positively correlated with the copy-number of ml-3 gene (n = 10 for each group). p<0.0001 by one-way ANOVA. ****, p<0.0001 by Student's t-test. Leu, leucophore; Xan, xanthophore; DS, dorsal stripe; LS, lateral stripe; VS, ventral stripe. Scale bars: 250 µm.

