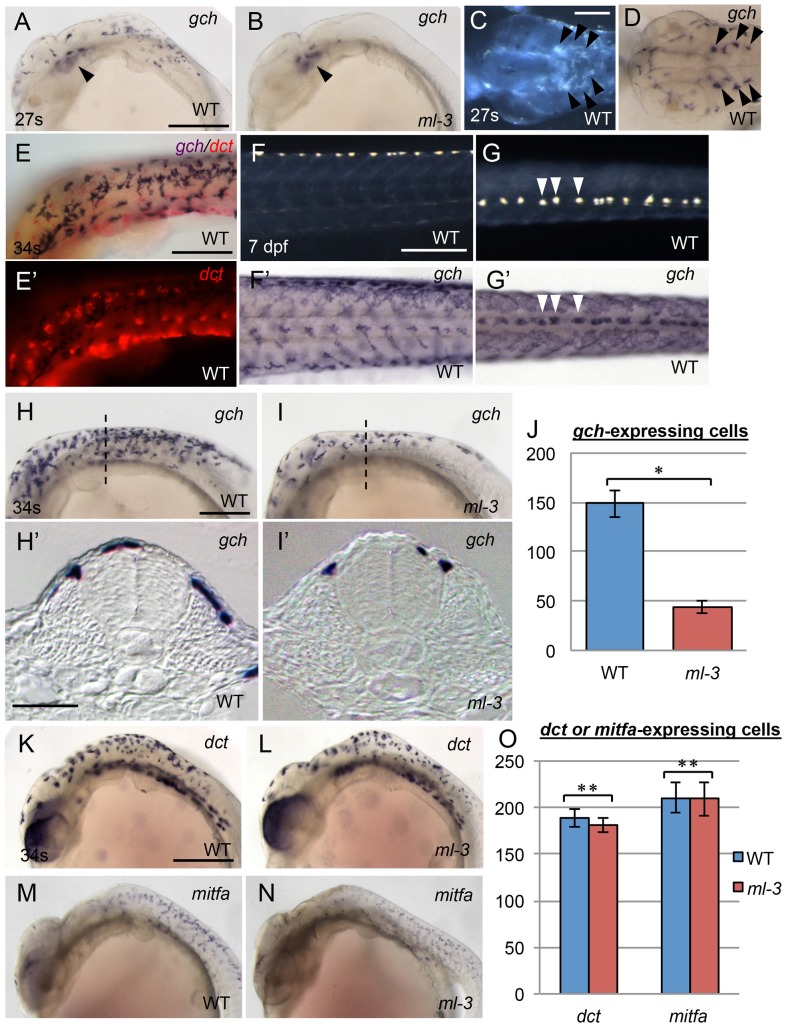
Figure 2. Embryonic pigment cell precursor formation in ml-3 mutants.
(A, B, D, F′, G′, H, I), gch. (K, L), dct.(M, N), mitfa. (E, E′) gch (blue) and dct (red). (A, C–H, K, M) WT. (B, I, L, N) ml-3 mutant. (A, B, E, F, H, I, K–N) Lateral views. (C, D, G) Dorsal views. (H′, I′) Transverse sections. (C, F, G) Pre-fixed samples in darkfield. (A–D) 27 somite stage (27 s, 61 hpf). (E, H, I, K–N) 34 somite stage (34 s, 74 hpf). (F, F′, G, G′) 7 dpf. (A–I) ISH analyses show gch expression in WT xanthophores and leucophores. Whereas gch-expressing cells are found over the lateral and anterior trunk surface and the head in WT at 27 s (A) as well as in ventral head leucophores (black arrowheads, C, D), ml-3 embryos have gch expression only in ventral head leucophores (black arrowheads, B). The embryo at 34 s is co-stained with gch riboprobe (purple) and dct riboprobe (red) (E, E′). gch signals show no overlap with dct signals. At 7 dpf, gch expression is detected on the surface of the whole length of trunk in WT (F′, G′). The dotted gch signals in the dorsal midline coincide with leucophore positions (compare F′ with F and G′ with G, some examples were represented by white arrowhead in G and G′). In WT at 34 s (H), gch-expressing cells are spread more posteriorly and scattered over the dorsal trunk surface (H′). In ml-3 mutants (I), gch expression is in fewer cells (J), and these are restricted to the dorsal trunk surface (I′) compared with WT. Transverse histological section from embryos at the level as indicated by dotted line in H and I. (J) Counts of gch-expressing cells at 34 s (n = 11 for WT, n = 10 for ml-3). The number is significantly fewer in ml-3 than in WT (*, p<0.0001 by Student's t-test). (K–N) Melanophore precursors, detected using dct (K, L) and mitfa (M, N) are not markedly altered in ml-3 (L, N) as compared with WT (K, M). (O) The number of dct- or mitfa-expressing cells is not significantly different between WT and ml-3 (dct, n = 11 for each group, **, p>0.05 by Student's t-test; mitfa, n = 12 for each group, **, p>0.05 by Student's t-test). (J, O) Mean (±s.d.) counts are shown as bars in blue (WT) and in red (ml-3). Scale bars: (A, F, H, K) 250 µm; (C) 100 µm; (E) 150 µm; (H′) 25 µm.

