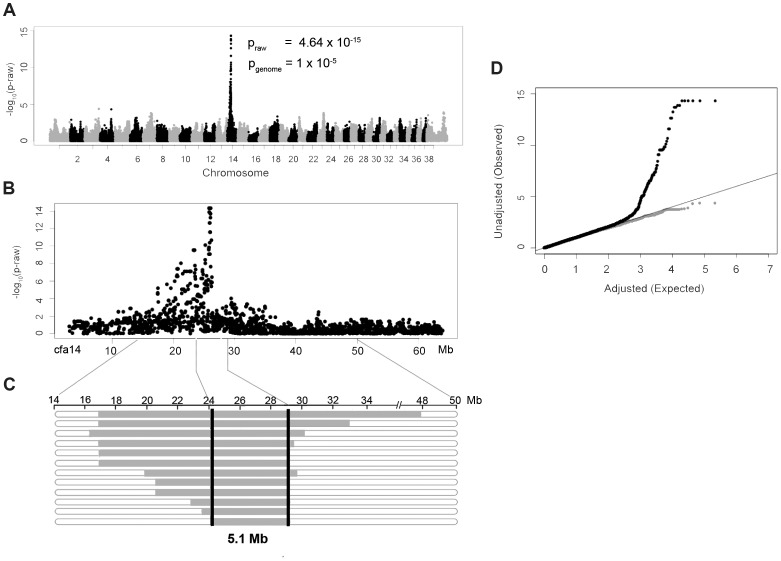
Figure 1. Genome-wide association study results of NSDTRs with CP.
A. Manhattan plot of −log10 of raw p-values by chromosome. The pgenome value is the p-value after 100000 permutations. The lowest pgenome is found across 8 SNPs on cfa14: 25822897, 25832747, 25847915, 25854827, 25868609, 25995782, 26023199, and 26082330. B. Plot of the raw p-values by Mb on cfa14 depicting the associated region. C. Observed haplotypes in 12 CP NSDTRs. Horizontal bars represent haplotypes from the 12 CP NSDTRs with associated haplotype, with runs of homozygosity in grey. The critical interval is defined by the shared homozygous haplotype denoted by the black bars (cfa14. 24189817-29319290). The 2 CP NSDTRs without the associated haplotype are not included in this figure. D. Quantile-Quantile plot of genome-wide association results. Black dots represent the observed versus expected p-values of all SNPs (λ = 1.05). Grey dots represent the observed versus expected p-values after removal of all SNPs on cfa14. (λ = 1.02). The solid grey line represents the null hypothesis: observed p-values equal expected p-values.

