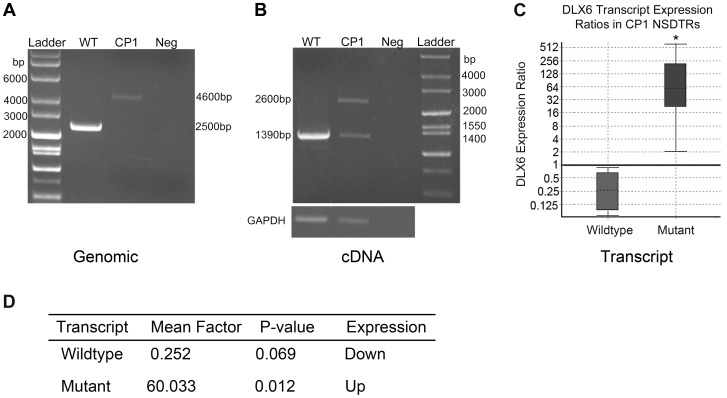
Figure 3. PCR amplification and expression analysis of LINE insertion in CP1 and WT NSDTRs.
A. Gel image of long range PCR amplification of the DLX6 intronic LINE-1 insertion from genomic DNA of an unaffected NSDTR (WT; 2500 bp band), CP1 NSDTR (CP1; 4600 bp band), and negative water control (Neg). CP1 has a 2.1 kb LINE insertion. B. Gel image of RT-PCR amplification of DLX6 from WT and CP1 cDNA. CP1 expresses both a wildtype (1390 bp) and mutant (2600 bp) transcript. The mutant transcript has a 1.2 kb insertion. GAPDH was used to control for cDNA concentrations. C. Relative DLX6 gene expression ratios by transcript of cerebral cortex cDNA from 3 neonatal CP1 NSDTRs compared to 3 neonatal WT NSDTRs. Boxes represent the interquartile range, and the dotted lines within represent median gene expression. Whiskers of the boxplot represent minimum and maximum observations. Relative expression levels were normalized to the housekeeping gene, B2M. Statistical significance is reported as p<0.05(*). D. Summary of relative expression of wildtype and mutant DLX6 transcripts of CP1 NSDTRs compared to WT NSDTRs. Fold change and p-values were calculated using REST2009 [24].

