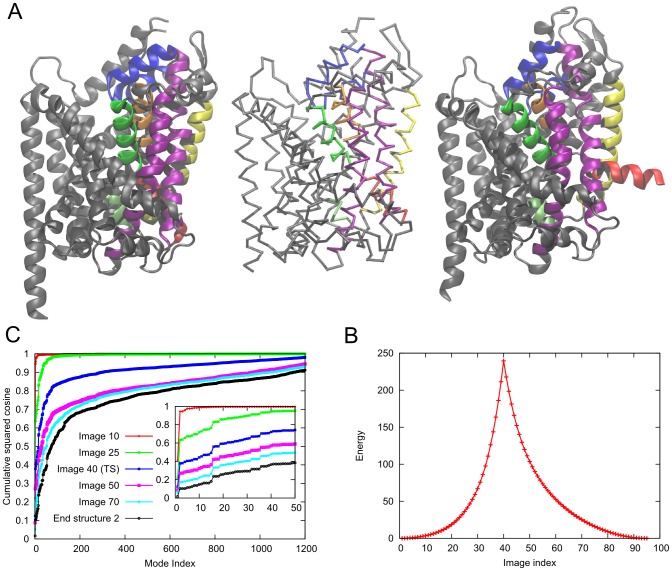
Figure 3. Conformational transition between the outward-facing occluded/closed (OFc) and the inward-facing open (IFo) states of leucine transporter, LeuT.
A. Structures of the OFc state (left, PDB ID: 2A65) and the IFo state (right, PDB ID: 3TT3). The scaffold domain, which does not undergo significant conformational changes, is shown in gray and the rest of the protein is shown in blue (EL4), red (TM1a), orange (TM1b), purple (TM2 and TM7), yellow (TM5), green (TM6a) and lime (TM6b). The central structure is the  trace of the transition state produced by the ANMPathway method. B. The energy of the system along the transition. Total number of images in the pathway is 95, RMSD between two consecutive images is ∼0.05 Å. The transition state corresponds to image 40. C. Cumulative squared cosines between the structural change to reach a few selected conformers/images along the transition pathway and the ANM modes accessible to the starting (outward-facing occluded) structure.

