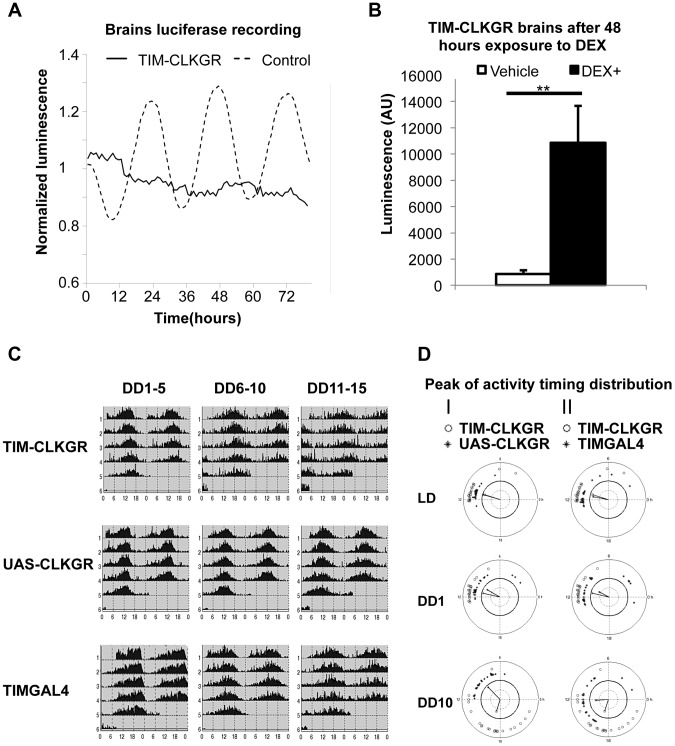
Figure 5. TIM-CLKGR flies display quasi-normal locomotor activity rhythms despite impaired transcriptional oscillations in the brain.
A. Expression of CLKGR leads to impaired transcriptional oscillations in brains in culture. Luciferase recordings from cultured isolated brains of TIM-CLKGR and control flies. In both cases, we assayed females flies; n = 8 for each strain, brains were maintained at 12 hours light, 12 hours dark light regime (LD). A representative experiment (out of three) is showed. B. Addition of dexamethasone induces CLK-driven transcription in cultured TIM-CLKGR brains. Same TIM-ClKGR brains as A. Luminescence mean values after 48 hours exposure to dexamethasone (DEX) (DEX n = 8, vehicle n = 7). A representative experiment (out of three) is showed. Error bars represent SEM. Wilcoxon test was performed to determine statistical significance **p<0.01. C. TIM-CLKGR flies display less robust rhythmic behavior after long time in constant darkness. Average locomotor activity of TIM-CLKGR and control flies during five days periods in constant darkness (DD). Behavior was plotted for the first 5 days in constant darkness (DD1–5) days 6 to 10 in constant darkness (DD6–10) and days 11 to 15 in constant darkness (DD11–15). Fly strains: TIM-CLKGR, TIMGAL4 (tim-gal4/+) and UAS-CLKGR (UAS-ClkGR/+) (rhythms data and flies numbers are shown in Figure S6.) D. TIM-CLKGR flies display spread peaks of activity after prolonged times in constant darkness. We plotted the distribution of the activity peaks of individual flies in a circular chart. We did so at different times after starting the experiment: the last day of 12∶12 LD conditions, first day in constant darkness (DD1) and day 10 in constant darkness (DD10). White circles represent TIM-CLKGR individual flies. I) Black dots represent UAS-CLKGR (UAS-ClkGR/+) individual flies. II) Black dots represent TIMGAL4 (tim-gal4/+) individual flies.

