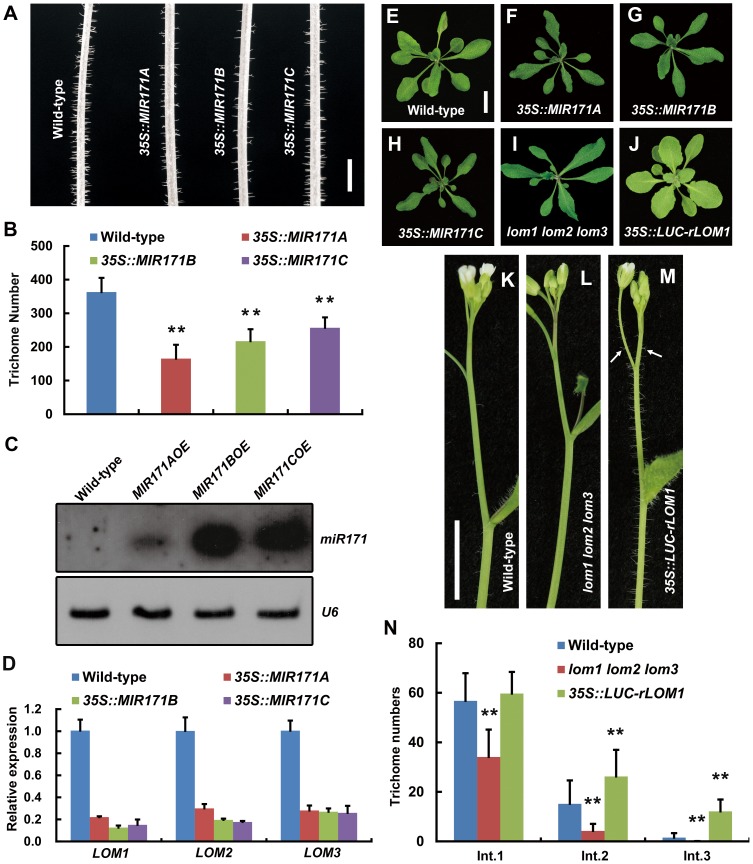
Figure 1. MiR171-LOMs regulate trichome initiation.
(A) Trichome distribution on main stem of wild-type (Col-0) and MIR171OE (35S::MIR171A/B/C) plants; MIR171 overexpression decreased trichome density. Scale bar represents 5 mm. (B) Overexpression of MIR171 reduced the total number of trichomes on stems. Trichome numbers on main stems (0 to 5 cm from bottom) were counted and data were given as mean s.d. (n = 18) and analyzed by t test. **P<0.01. (C) RNA blots showing high accumulation of mature miR171 in 10-day-old MIR171OE plants. U6 was used as an internal reference. (D) qRT-PCR showing repressed expression of LOM1, LOM2 and LOM3 in MIR171OE plants. Expression level in the wild-type was set to 1. Errors bars indicate s.d. (n = 3). Three biological replicates were analyzed, with consistent results. (E–J) View of 15-day-old plants of indicated genotypes. Overexpression of MIR171 resulted in dark-green and narrower leaves. MIR171OE transgenic plants showed similar phenotypes as lomt (lom1 lom2 lom3) mutant (I). On the contrary, 35S::LUC-rLOM1 transgenic plants (J) showed yellow-green leaves. Scale bar in (E) represents 1 cm for (E–J). (K–M) Spatial distribution of trichomes on main stem of wild-type, lomt and 35S::LUC-rLOM1 plants. Arrows in (M) indicate the ectopic trichomes on the main inflorescence stems and pedicels. Scale bar in (K) represents 1 cm for (K–M). (N) Trichome density on main stem of wild-type, lomt and 35S::LUC-rLOM1 plants. The Int.1 to Int.3 represents the main stem internodes from bottom to top. The y axis indicates trichome number per centimeter of each internode. Data are given as mean s.d. (n>16) and analyzed by t test. **P<0.01.

