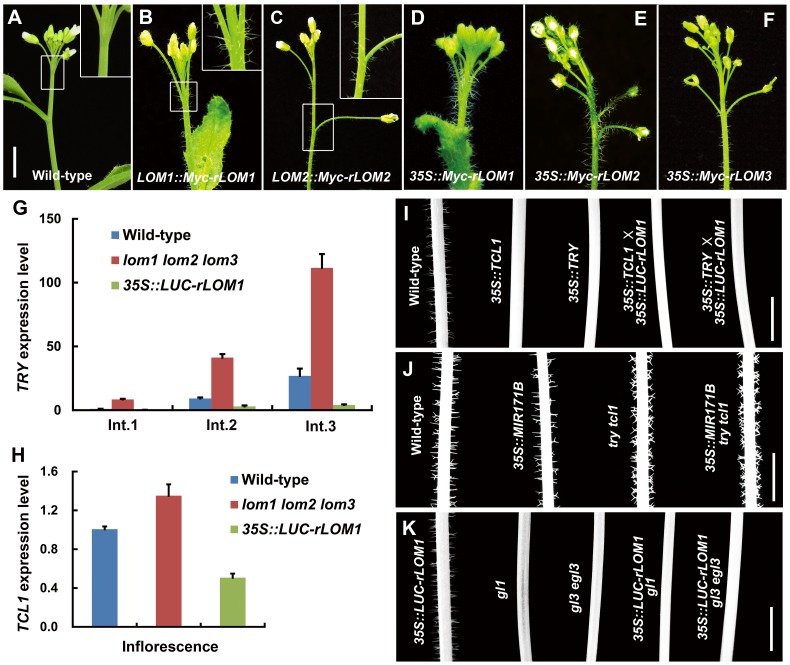
Figure 2. Elevated LOMs trigger ectopic trichomes and down-regulate TRY and TCL1.
(A–F) Trichomes on main stems and inflorescences of different plants as indicated. The insertion panel in the top right corner in (A–C) represents magnified image of the area marked by square; note that ectopic trichomes appeared on inflorescence stems and pedicels in (B) and (C). Scale bar shared in (A–F), 1 cm. (G) Relative expression level of the trichome repressor gene TRY in main stem of wild-type, lomt and LUC-rLOM1OE plants. The Int.1 to Int.3 represent the stem internodes from bottom to top. Expression level in Int.1 of wild-type was set to 1. Error bars indicate s.d. (n = 3). (H) Relative expression level of TCL1 in inflorescences of wild-type, lomt and LUC-rLOM1OE plants. Errors bars indicate s.d. (n = 3). For (G) and (H) three biological replicates were analyzed with similar results. (I–K) Trichome distribution on main stems (Int.1) of different genetic background plants as indicated. Note that TCL1 and TRY are epistatic to LOM1, as LUC-rLOM1OE did not induce trichome production in TCL1OE and TRYOE backgrounds (I). MIR171BOE did not reduce trichome density in try tcl1 double mutant (J). 35S::LUC-rLOM1 failed to rescue the glabrous phenotype of gl1 and gl3 egl3 mutants (K). Scale bars in (I–K) represent 1 cm.

