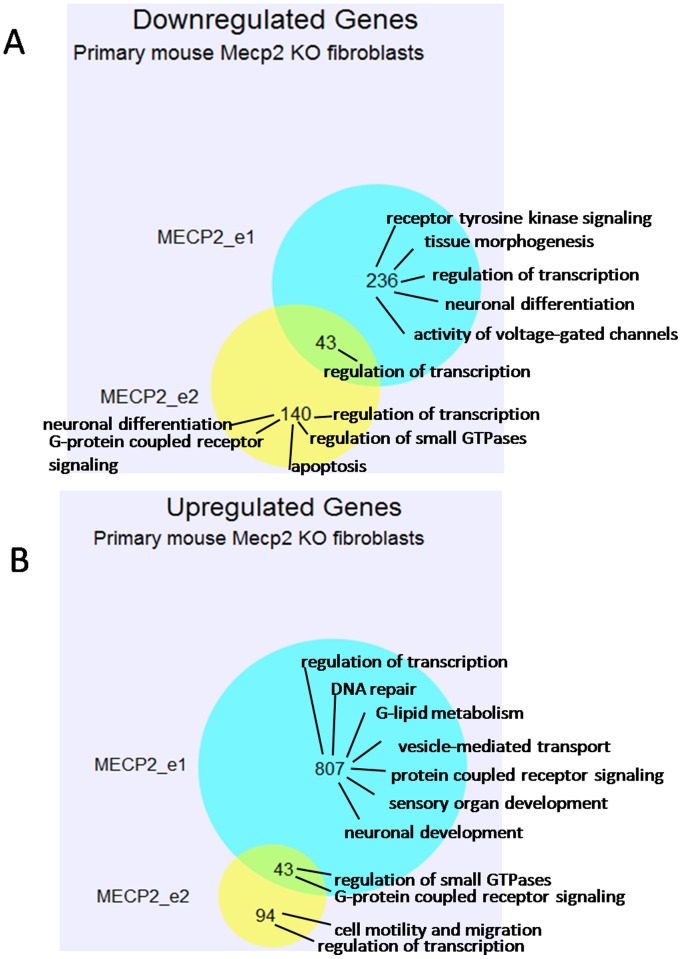
Figure 3. Venn diagram showing the number of genes identified by microarray analysis as down-regulated (A) or up-regulated (B) at least two fold by overexpression of MECP2_e1 isoform (blue), MECP2_e2 isoform (yellow), or both isoforms (intercept) in primary fibroblasts derived from Mecp2 knockout mice.
Biological processes that indicated gene sets are enriched for, as identified by DAVID Gene Ontology Functional Clustering, are indicated on the right hand side of Venn diagrams.

