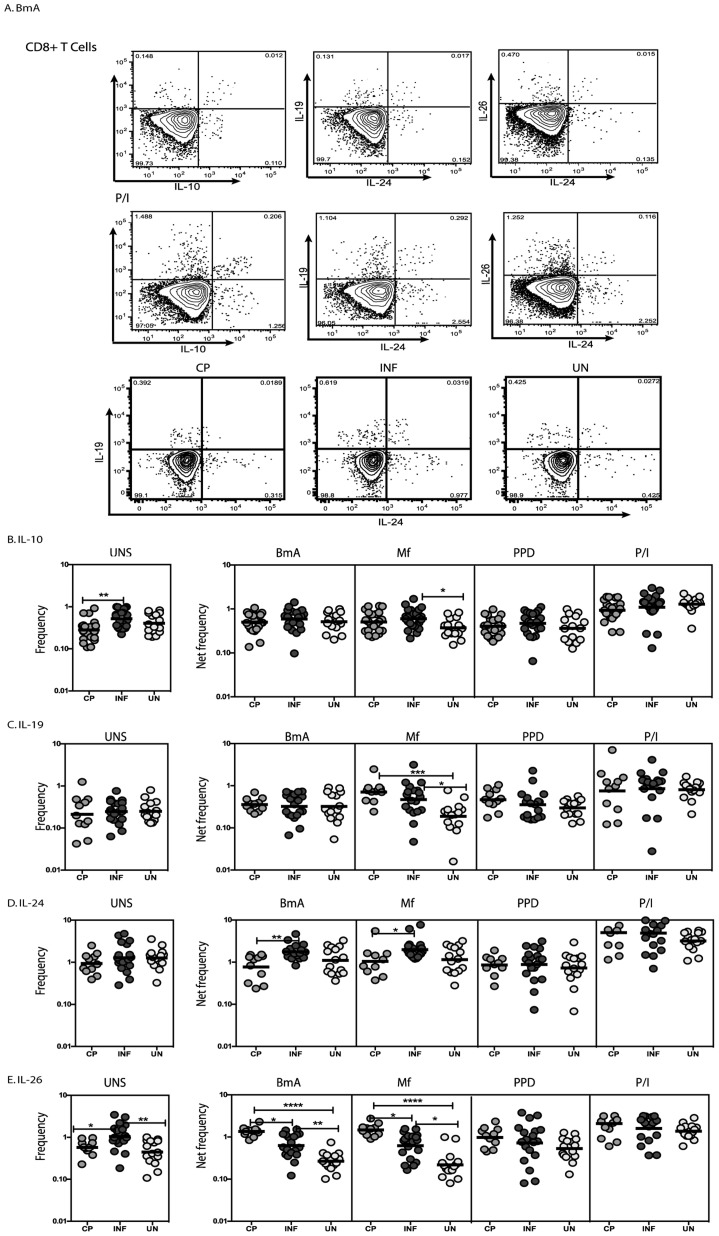
Figure 2. Filarial infection is associated with increased frequencies of IL-24 expressing and decreased frequencies of IL-26 expressing CD8+ T cells.
(A) A representative dot plot from a filarial - infected individual showing CD8+ T cell expression of IL-10, IL-19, IL-24 and IL-26 in response to BmA and PMA/Ionomycin and representative dot plots from CP, INF and UN individuals for CD4+ T cell expression of IL-19 and IL-24. The frequencies of CD8+ T cells expressing IL-10 (B), IL-19 (C), IL-24 (D) and IL-26 (E) at baseline and following stimulation with BmA, Mf, PPD and PMA/ionomycin in CP (n = 23), INF (n = 25) and UN (n = 15) individuals. Antigen – stimulated frequencies are shown as net frequencies with the baseline levels subtracted. The data are shown as scatter plots with each circle representing a single individual. P values were calculated using the Kruskal-Wallis test with Dunn's multiple comparisons (* p<0.05, ** p<0.01, *** p<0.001).

