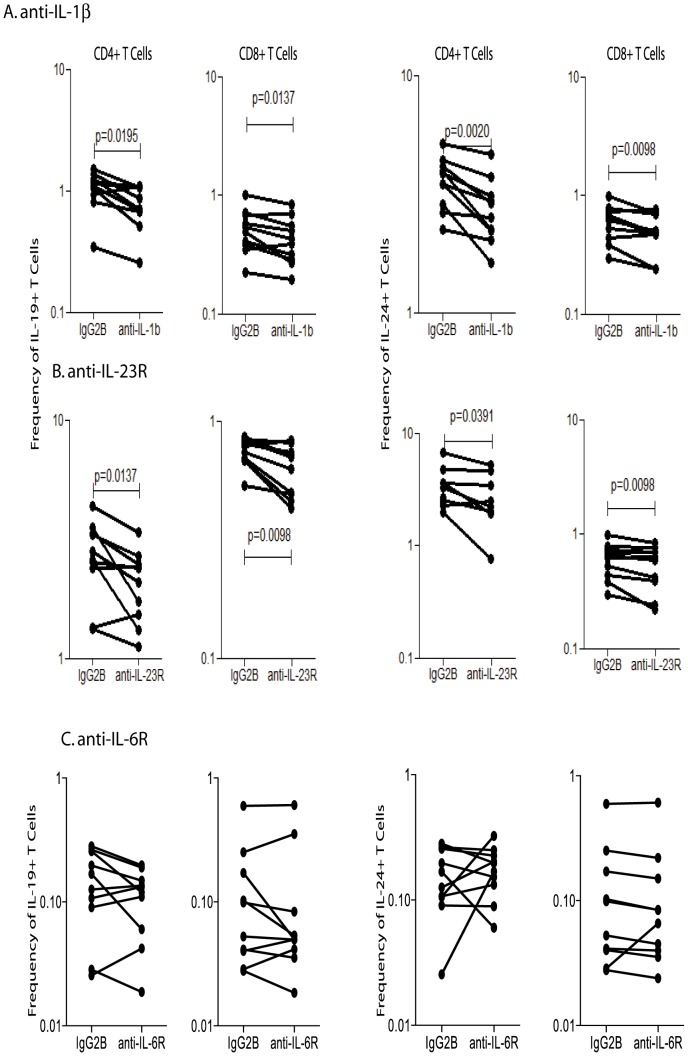
Figure 5. IL-1β and IL-23 regulate the frequencies of CD4+ and CD8+ T cells expressing IL-19 and IL-24 in filarial infections.
(A) The frequencies of CD4+ and CD8+ T cells expressing IL-19 and IL-24 following IL-1β neutralization and stimulation with BmA in a subset of INF individuals (n = 10). (B) The frequencies of CD4+ and CD8+ T cells expressing IL-19 and IL-24 following blockade of IL-23R and stimulation with BmA in a subset of INF individuals (n = 10). (C) The frequencies of CD4+ and CD8+ T cells expressing IL-19 and IL-24 following blockade of IL-6R and stimulation with BmA in a subset of INF individuals (n = 10). Antigen – stimulated frequencies are shown as net frequencies with the baseline levels subtracted. Each line represents a single individual. P values were calculated using the Wilcoxon signed rank test.

