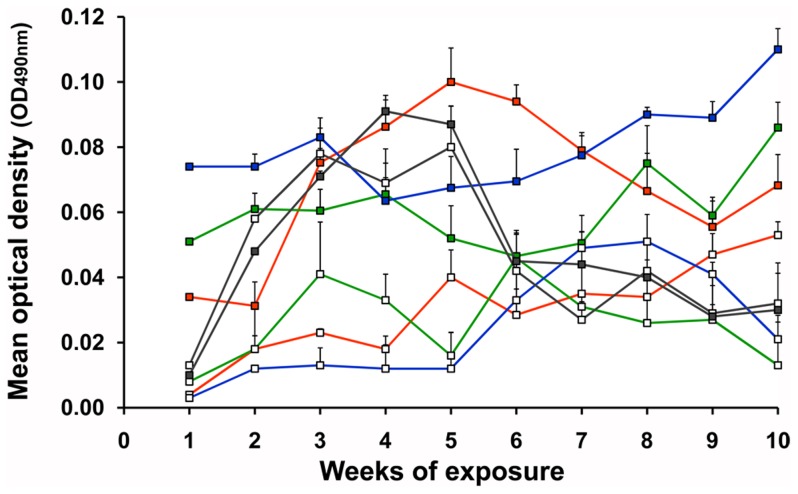
Figure 4. IgM antibody response of guinea pigs to saliva of T. infestans.
Eighteen guinea pigs were either exposed to nymphs (white squares) or adults (colored squares) of three different T. infestans from Argentina (blue line), Bolivia (red line) and Chile (green line). A second group of three guinea pigs was exposed to a set of nymphal (n = 10, white squares) and adult (n = 10, colored squares) T. infestans from Peru (grey line). Sera from all exposure events were tested either with crude saliva of nymphs or adults in ELISA assays to monitor the development of the IgM antibody response in guinea pigs. Mean optical densities (O.D.490 nm) of each exposure subgroup (3 guinea pig sera) were calculated after subtracting the O.D.s of the negative controls (pre-exposures). The final mean O.D.s presented in this graph were calculated from two independent ELISA assays.

