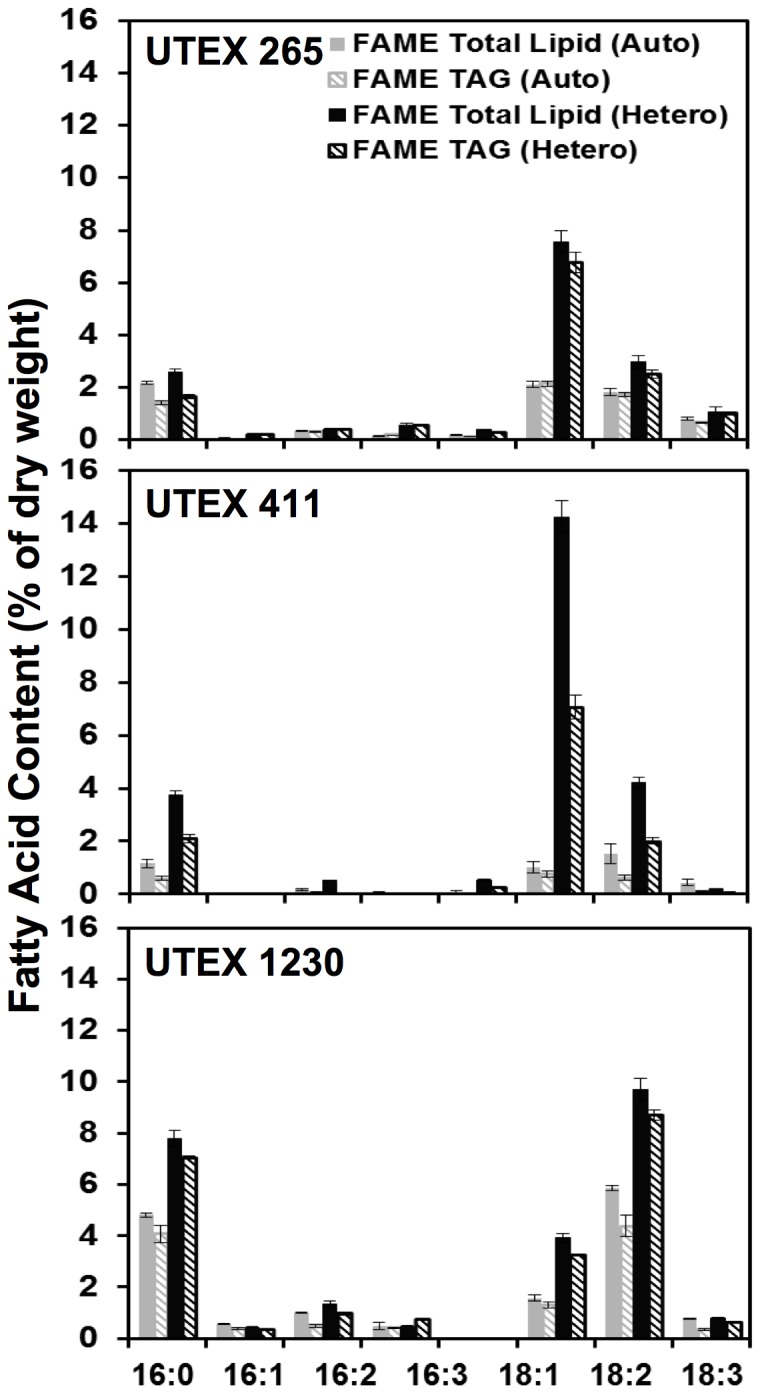
Figure 4. Fatty acid composition of three Chlorella strains during auto– and heterotrophy.

The distribution of total fatty acids measured as FAME and TAG are plotted as solid and diagonal bars, respectively, for C. protothecoides UTEX 411, C. vulgaris UTEX 265, and C. sorokiniana UTEX 1230. Compared to autotrophy (gray), heterotrophy (black) induces remarkable changes in FAME and TAG lipid profiles. Error bars represent the standard deviation from the average of three biological replicates.
