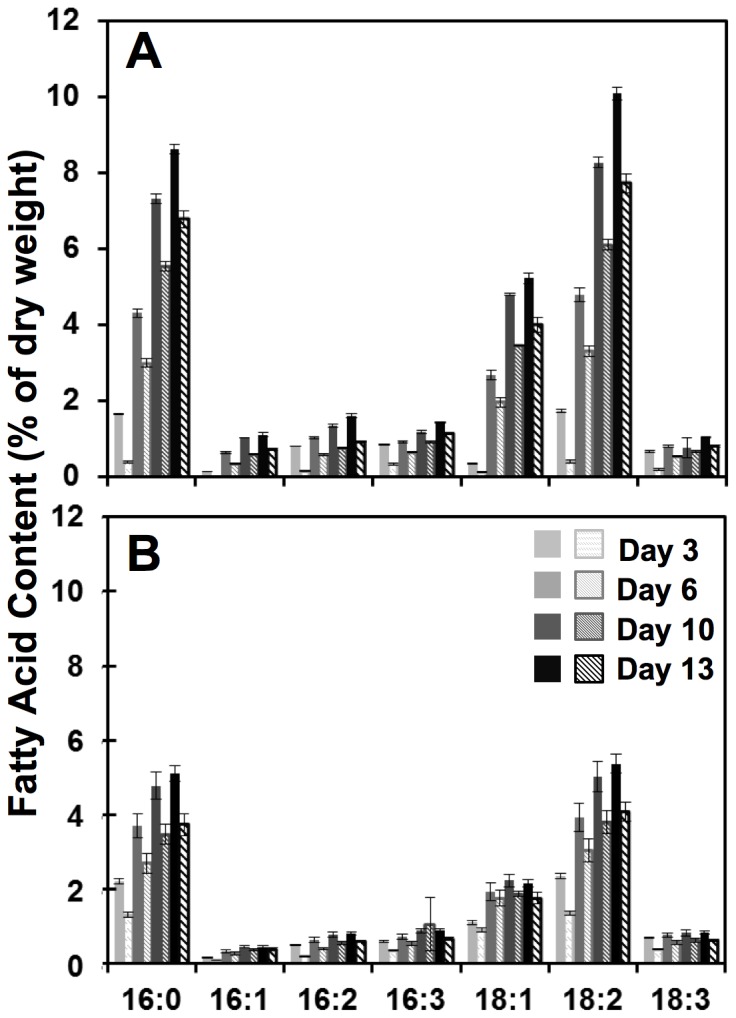
Figure 6. Comparison of total fatty acid and TAG composition of UTEX 1230 during mixo– and heterotrophic cultivation.

The discrete lipid profiles of C. sorokiniana UTEX 1230 under (A) heterotrophic and (B) mixotrophic conditions from samples taken on days 3, 6, 10 and 13 of cultivation show fatty acid accumulation rates and patterns. Total FAME and TAG contents for each lipid type are plotted as solid and diagonal bars, respectively. Error bars represent the standard deviation from the average of three biological replicates.
