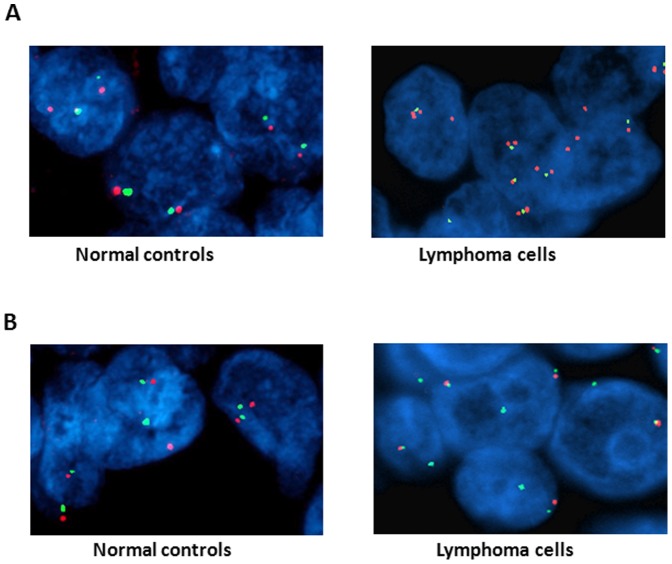
Figure 2. FISH validation of copy number variation detected by Cytoscan HD analysis.
(A) Representative images of FISH analysis using probes specific for BRAF (7q34, red) and centromere of chromosome 7 (green). Left, normal diploid control, right-case 4 lymphoma (BRAF amplified). (B) Representative images of FISH analysis using probes specific for CITED2 (6q23.3, red) and centromere of chromosome 6 (green). Left, normal diploid control, right-case 2 lymphoma (CITED2 deleted).

