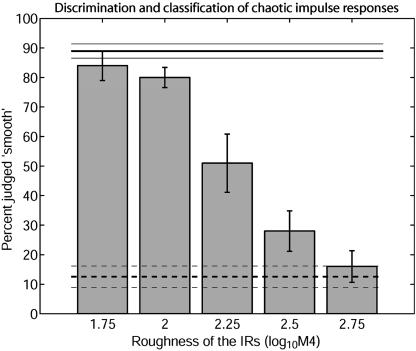
Fig. 3.
Discrimination and classification of chaotic IRs by P. discolor. Performance is quantified as percent of trials judged as smooth. The solid and dashed strong horizontal lines show the discrimination of the smooth and rough IR in the training trials, respectively. The thin horizontal lines represent standard errors. The bars show the spontaneous classification of unknown chaotic IRs as a function of IR roughness. The bats' spontaneous classification is monotonically related to the IR roughness. Error bars represent interindividual standard errors.

