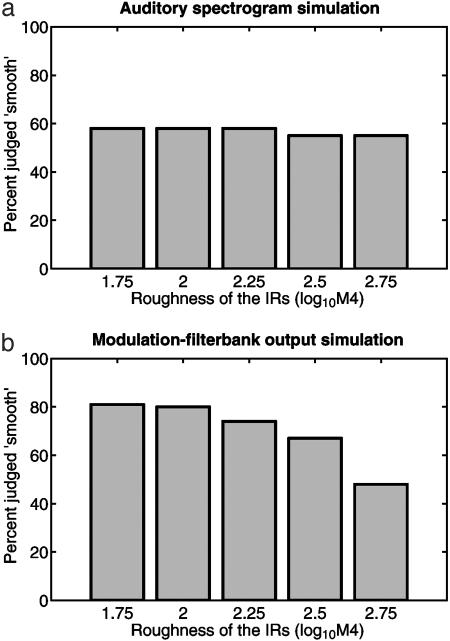
Fig. 6.
Simulation results of the behavioral performance based on two different auditory representations of the generated echoes. The simulation based on auditory spectrograms (a) provides a poor fit to the experimental data (Fig. 3) because, in the auditory spectrogram, the temporal structure of the echo waveform is encoded in a deterministic fashion. A subsequent analysis of the auditory spectrograms in a modulation filterbank (b) provides a better representation of echo roughness and consequently results in an improved fit to the experimental data.

