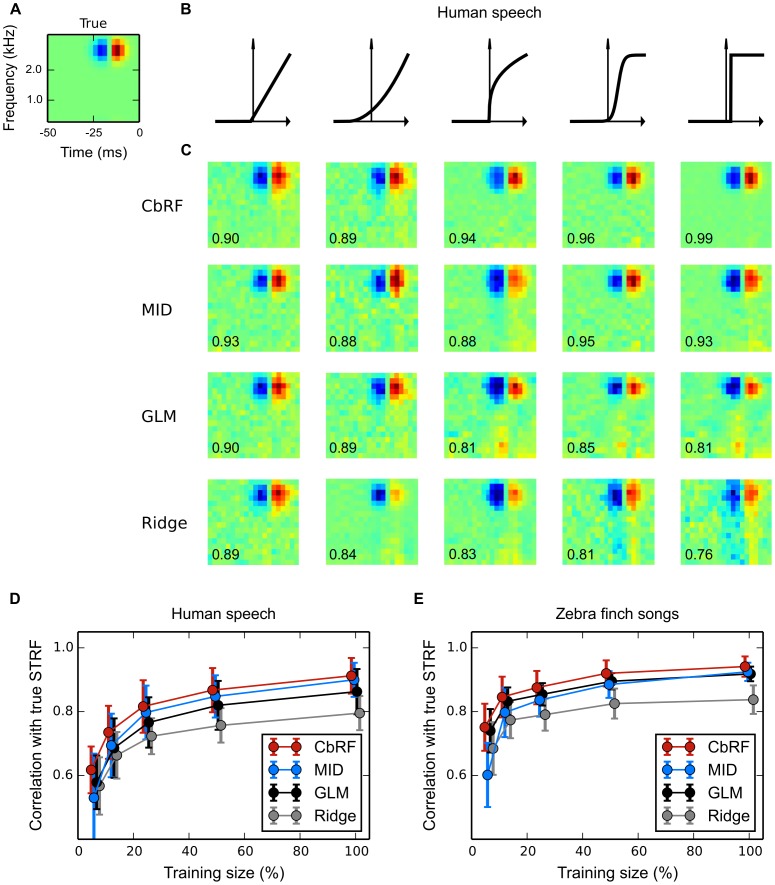
Figure 6. Spectro-temporal receptive field (STRF) estimation from simulated responses to natural stimuli: Robustness to neuronal nonlinearity.
(A) Ground truth spectro-temporal linear RF filter used in LNP model simulations of spike responses to four minutes of human speech. (B) Different static nonlinearities utilized in the LNP model, ranging from linear to step-like, the output of which was used for Poisson process spike train generation. (C) Linear RF filter estimates obtained with four estimation methods (rows, explanation cf. Table 1) for each of the nonlinearities in panel B (columns). Numbers indicate correlation of estimated with true RF filter. CbRF and MID methods reliably recovered the true linear filters. The GLM shows a bias when the assumed exponential inverse link function deviates from the static nonlinearity used to generate the data, e.g., for the compressive, sigmoid, and threshold nonlinearities. (D) Average correlation between true and estimated linear filter for speech stimuli of varying length. An ensemble of model cells was created using different linear filters and different nonlinearities from panel B with randomly chosen parameters. Shown are the correlations' mean and standard deviation across 150 model cells for each method. With mean correlation about 0.93 for 100% (four minutes) of the data, CbRF and MID yield higher correlation than GLM and ridge regression. Towards smaller sample sizes, CbRF method performance declines slower than the other methods' including MID's. Bias of the linear ridge regression estimator may be due to the highly non-Gaussian structure of human speech. (E) Same experiment as in D but with conspecific zebra finch vocalization stimuli of total length three minutes. CbRF method resulted in highest mean correlation for all stimuli lengths. GLM and MID method showed similar performance for long stimuli with GLM declining less towards smaller sample sizes below 50%. The somewhat higher mean correlation values observed for ridge regression in comparison to panel D may be attributed to the fact that the zebra finch vocalizations were less non-Gaussian than human speech.

