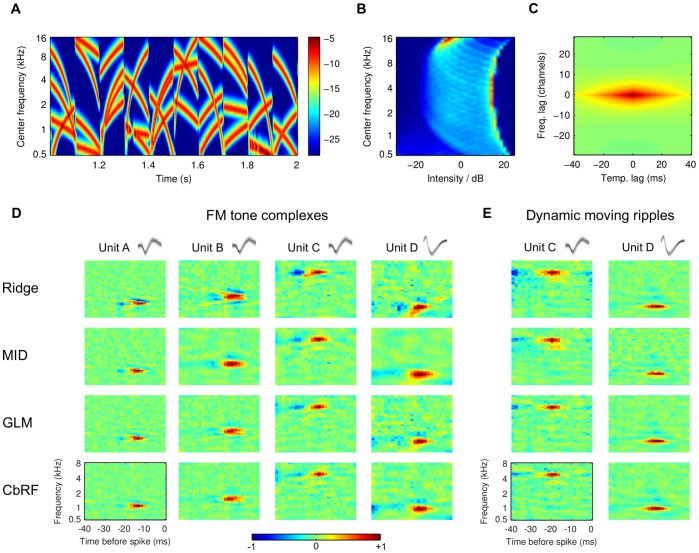
Figure 7. STRF estimation from gerbil inferior colliculus (IC) responses to frequency-modulated (FM) sweep complex stimuli.
(A) Example segment of block-design FM tone complex with length 1 s. Amplitude scaling in decibel (dB), dynamic range limited to 25 dB below maximum for visualization. (B) Stimulus amplitude histogram, shown for each spectral band after centering; red (blue) indicate high (low) probability, respectively. (C) Normalized spectro-temporal auto-correlation function of stimulus ensemble. (D) STRFs estimated from recorded responses of four gerbil IC units (columns) with four inference methods (rows, explanation cf. Table 1). All units had best frequency below 8 kHz and analysis was restricted to the range 0.5 kHz to 8 kHz. The spike waveform density function of each unit is shown on top of each column, verifying single-unit activity [66]. Spectro-temporally transient ("diagonal'') patterns that are exhibited in the ridge regression-based estimates (top row) lack confirmation in the MID-, GLM-, and CbRF-derived STRF estimates (lower three rows). Thus, we hypothesize that these are an artefactual result originating from higher-order correlations and distribution asymmetries within the stimulus ensemble which the ridge regression method is not robust to. In general, MID, GLM, and CbRF produce very similar STRF estimates, with the latter two methods revealing a slightly finer tuning in some cases. (E) Validation experiment with dynamic moving ripple (DMR) stimuli responses recorded from two identical units (units C and D) as shown in experiment panel D. Spectro-temporal transients absent in all methods' STRF estimates, presumably due the absence of higher-order correlations in the DMR stimuli and consistent with the explanation of panel D results.

