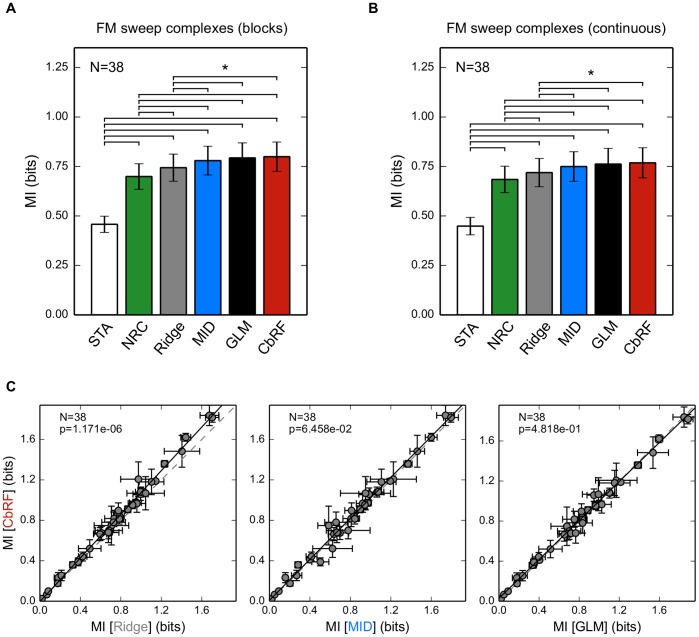
Figure 8. Population analysis of STRF estimation for gerbil IC units using FM sweep complex stimuli in block–design and continuous–onset–design.
(A) Predictive power for the different methods in terms of cross-validated mutual information (MI) between stimulus and response, showing mean and standard error. CbRF, MID and GLM perform almost identically with no significant difference between the methods. Linear estimators (STA, NRC, ridge regression) show significantly lower predictive power.  denotes statistical significance (paired Wilcoxon test;
  ). (B) Same experiment as panel A, but for 38 IC responses to continuously starting FM sweep complexes recorded in a separate neural subpopulation. (C) Predictive power of the CbRF method for single units compared to ridge regression, MID and GLM. Shown are mean and standard deviation across five cross-validation folds for the 38 IC units in panel A.

