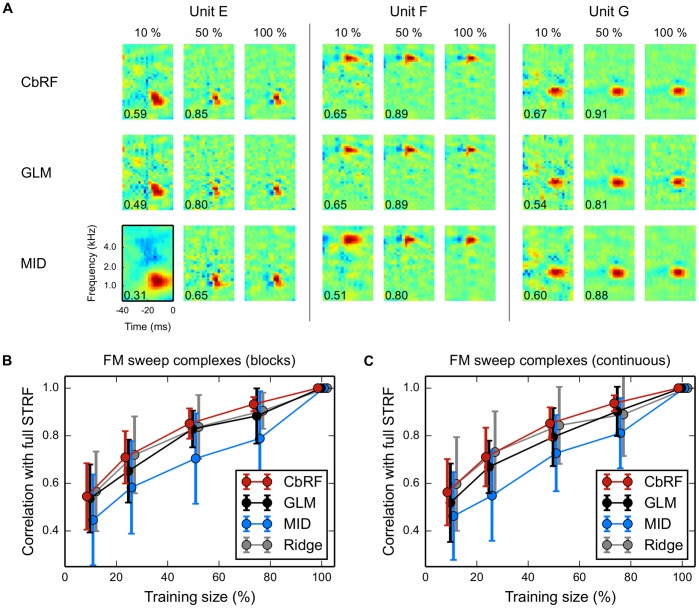
Figure 9. Convergence properties.
STRFs have been estimated using a subset of the data and compared to the full data estimates as described in the text. (A) Example STRFs for three units estimated using CbRF, GLM, and MID using 10%, 50%, and 100% of the data, respectively. Numbers in each STRF plot indicate correlation with the corresponding full (100%) estimate. (B) Relative convergence curves showing mean and standard deviation across 38 IC units for the block–design FM sweep complex stimuli for CbRF, GLM, MID and ridge regression. The CbRF method shows an average correlation of 0.9 (0.8) with the full STRF estimate for about 60% (35%) of the data. MID requires more than 87% (76%) to reach the same correlation. Performance of the GLM is between CbRF and MID. Across all experiments, CbRF has consistently lower standard deviations than MID, GLM and ridge estimation. Note that by contruction all curves reach correlation one with standard deviation 0 at training size 100%. Bars were shifted horizontally for visualization purposes (with GLM at correct horizontal locations). (C) Same experiment as in B, but for 38 IC responses to continuously starting FM sweep complexes.

