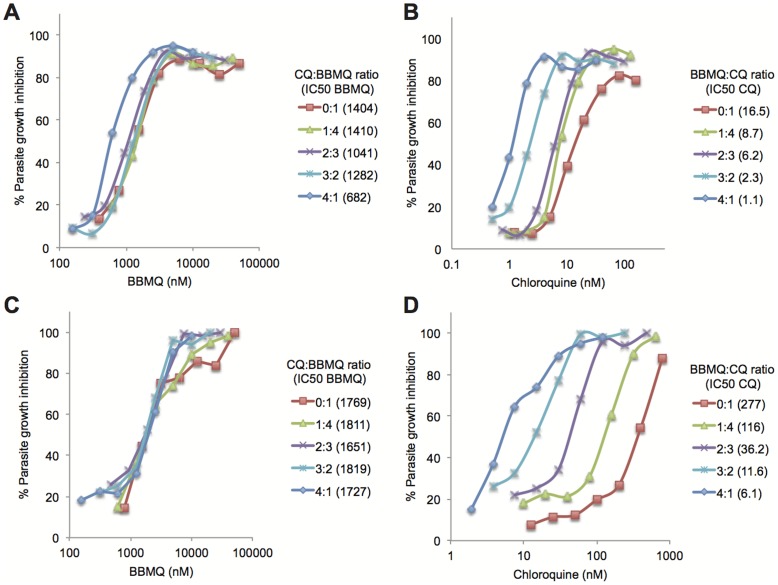
Figure 5. BBMQ-CQ isobologram analysis.
Growth inhibition curves for 3D7 (A and B) and K1 parasites (C and D) after 48 hours culture in the indicated concentrations and proportions of CQ and BBMQ. Data represent mean of triplicate wells analyzed in one experiment. The calculated IC50 for each compound at each mixture fraction is indicated in the figure keys (nM).

