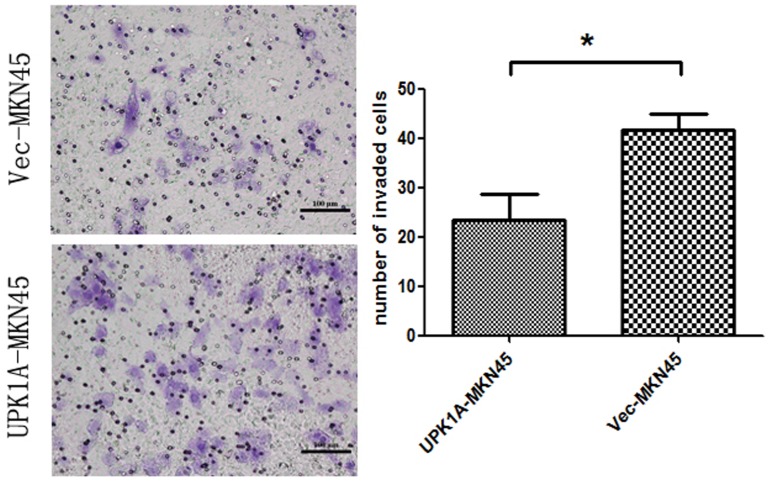
Figure 6. Matrigel invasion assays of vector-MNK45 and UPK1A-overexpressed MNK45 cells.
The invading cells were fixed and stained with crystal violet (magnification, 200×) on the left. The right images present the quantification of 10 randomly selected fields. The results represent the mean ± SD of three independent experiments. *, P<0.05.

