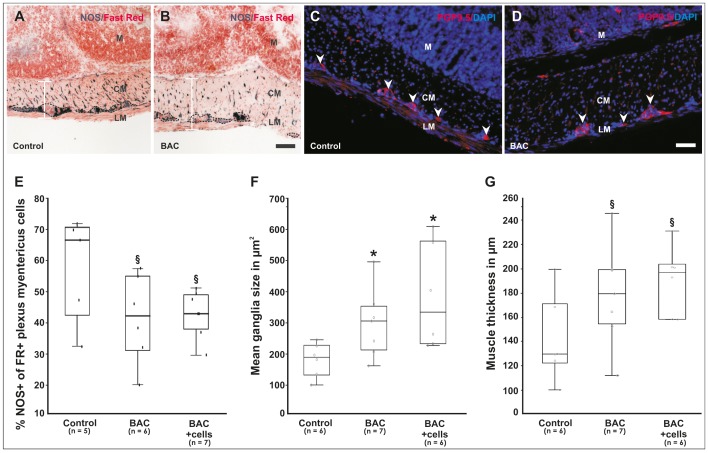
Figure 3. Alterations of the ENS four weeks post-operation.
(A, B) Low-magnification bright-field view of NADPH-diaphorase staining demonstrates a visible and relative reduction (i.e. hypoganglionosis) of neuronal cells (shown as %NOS+ of Fast Red+ myenteric plexus cells, dotted lines) as well as neuronal fibers compared to untreated gut control tissues. Note that the musculature is thickened due to hypertrophic effects of BAC as indicated by the white bar. Nuclei are stained red with Nuclear Fast Red dye. (C, D) Compared to the control, hypertrophic effects are also detectable in the ENS as shown by immunohistochemistry for PGP9.5 (arrowheads). Nuclei were stained with DAPI (blue). (E) Quantification of NOS-positive cells in the myenteric plexus, (F) mean ganglia size indicated by PGP9.5 cytoplasmatic immunostaining, and (G) muscle thickness. As seen in box-whisker plots, damage of the ENS and muscle was still quantifiable four weeks after BAC-treatment, however in this analysis, no statistical significant effects were seen by additional cell transplantation compared to the BAC-only treated group. (A–D) Scale bars represent 100 μm. M = mucosa, CM = circular muscle, LM = longitudinal muscle. (E–G) *P<0.05 and 0.05< §P<0.15 as compared to the untreated controls.

