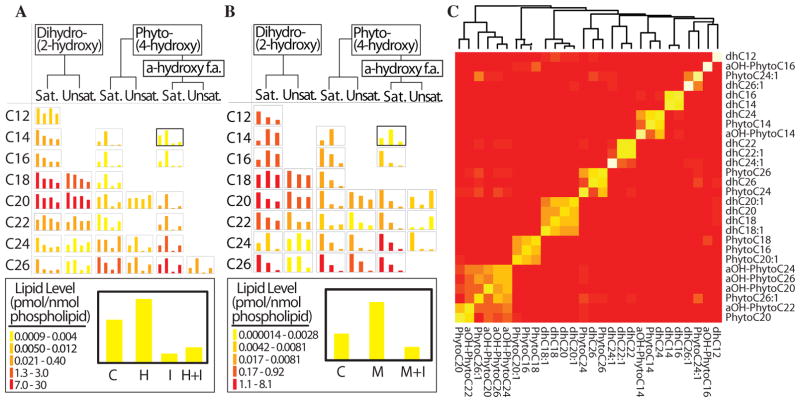
Fig. 3. Lipidomic Analysis.
A: Lipidomic response to heat stress/ISP1 treatment. Control (C), heat (H), ISP1 (I), heat plus ISP1 (H+I). B. Lipidomic response to myristate treatment. Control (C), myristate (M), myristate plus ISP1 (M+I). In A and B, rows represent N-acyl chain length; columns represent single combination of hydroxyl groups for each ceramide. Saturated (Sat.), monounsaturated (Unsat.) N-acyl chain. Bar height is averaged triplicate ceramide level; the range of each chart is color-coded. Legend inset: C14-alpha-hydroxy phytoceramide. C. Consensus clustering of lipidomic data. The heatmap of the consensus matrix reflects how frequently a pair of lipids is assigned to a common cluster during repeated sampling and clustering. A red cell in the matrix indicates that a pair of lipids tends to be assigned to mutually exclusive clusters and a yellow cell indicates that a pair tends to be assigned to a common cluster. Lipid name abbreviations: ‘dh’ dihydro, ‘aOH’ alpha hydroxy, and ‘C’ followed by a number indicates fatty acid chain length.

