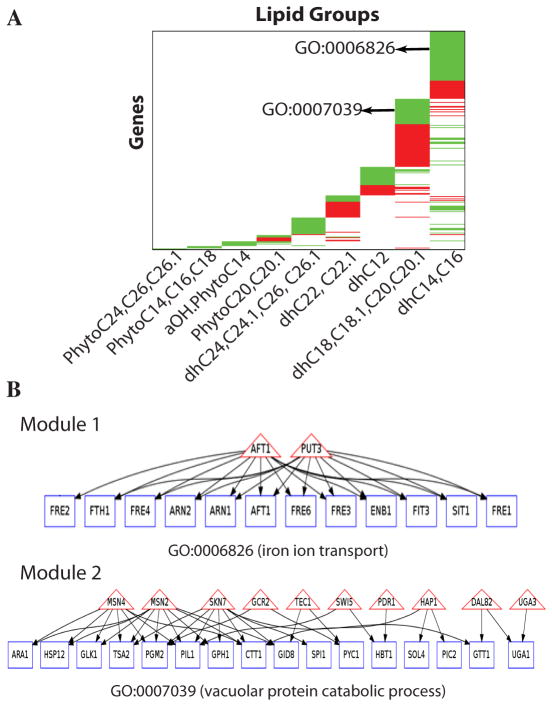
Fig. 5. Modeling relationship between lipidomic and gene expression data.
A. Organizing genes demonstrating significant correlation with specific ceramides. Genes (rows) are organized according to their association with the different lipid subgroups. A green block represents a set of genes negatively correlated to a lipid, and a red block represents a set of genes positively correlated to a lipid. Examples of major enriched GO terms within gene blocks are shown. B. Defining pathways of specific biologic modules that respond to specific ceramides, perform related functions, and share transcription factors. Two example modules are shown (all modules can be found at supplementary website). Rectangles represent lipid-correlated genes, triangles indicate the transcription factors shared by the genes; an edge from a transcription factor to a gene indicates that the gene has the binding sites for the transcription factor in its promoter. The function performed by the genes in a module is represented with a GO term.

