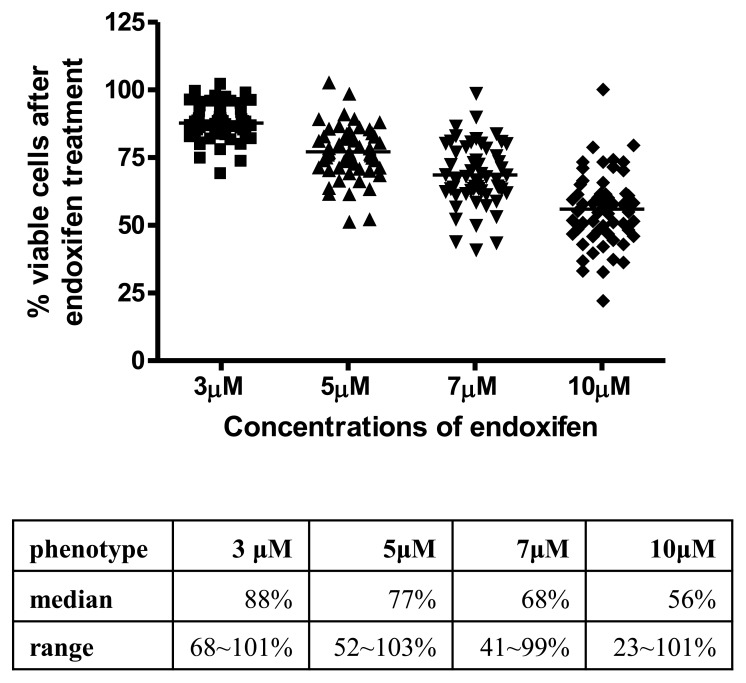
Figure 1. Scatter plot of endoxifen sensitivity in YRI LCLs.
X axis represents the 4 treatment concentrations of endoxifen (3, 5, 7 and 10 μM) and Y axis represents percent viable cells 72 hours after drug treatment. The table underneath shows median value and data range at each treatment condition.

