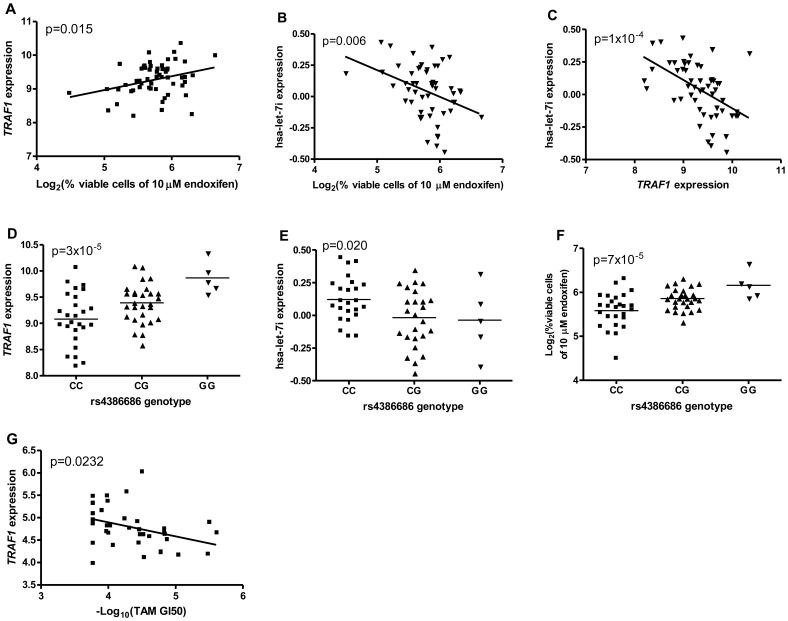
Figure 2. Relationships of endoxifen/TAM sensitivity, rs4386686, hsa-let-7i and TRAF1 expression.
A) Step1: association between TRAF1 expression and percent viable cells after 10 μM endoxifen treatment in YRI LCLs; B) Step2: association between hsa-let-7i expression and percent viable cells after 10 μM endoxifen treatment in YRI LCLs; C) Step 3: negative correlation of TRAF1 and hsa-let-7i expression in YRI LCLs; D) Step 4: association between TRAF1 expression and rs4386686 genotypes in YRI LCLs; E) Step 5: association between hsa-let-7i expression and rs4386686 genotypes in YRI LCLs; F) Step 6: association between rs4386686 and percent viable cells after 10 μM endoxifen treatment in YRI LCLs; G) association between TRAF1 expression and -log10(TAM GI50) in 44 breast cancer cell lines.

