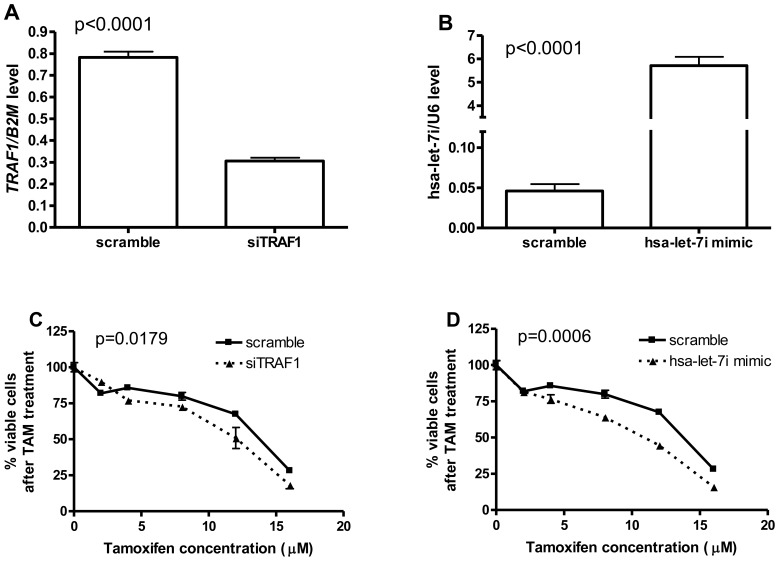
Figure 3. Increase of TAM sensitivity in breast cancer cell line ZR-75-1 with knock-down of TRAF1 or overexpression of hsa-let-7i.
A) Knock-down of TRAF1 with siTRAF1 results in significantly decreased relative TRAF1 expression characterized with qPCR; B) hsa-let-7i mimic transfection results in significantly increased relative let-7i expression characterized with qPCR; C) Increased TAM sensitivity in ZR-75-1 with knocking down of TRAF1; D) Increased TAM sensitivity in ZR-75-1 with over-expression of hsa-let-7i. P-values in panel A) and B) were calculated with paired t-test, while two-way ANOVA analysis was used to calculate p-values in panel C) and D). B2M and RNU6 expressions were used as housekeeping to calculate the relative levels of TRAF1 and hsa-let-7i expressions respectively.

