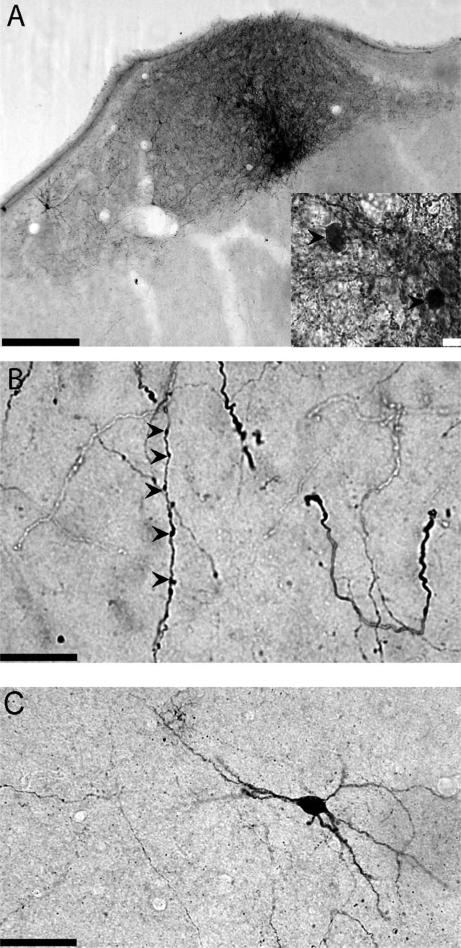
Figure 2.
A: Example of an injection site in HVC. Inset shows several cell bodies in HVC (arrowheads) labeled with BDA. B: BDA-labeled HVCRA axon arbors in RA. Examples of varicosities are marked with arrowheads. C: Retrogradely labeled cell body in RA following BDA injection in HVC. Scale bars = 100 μm in A; 10 μm in A, inset and B; 50 μm in C.

