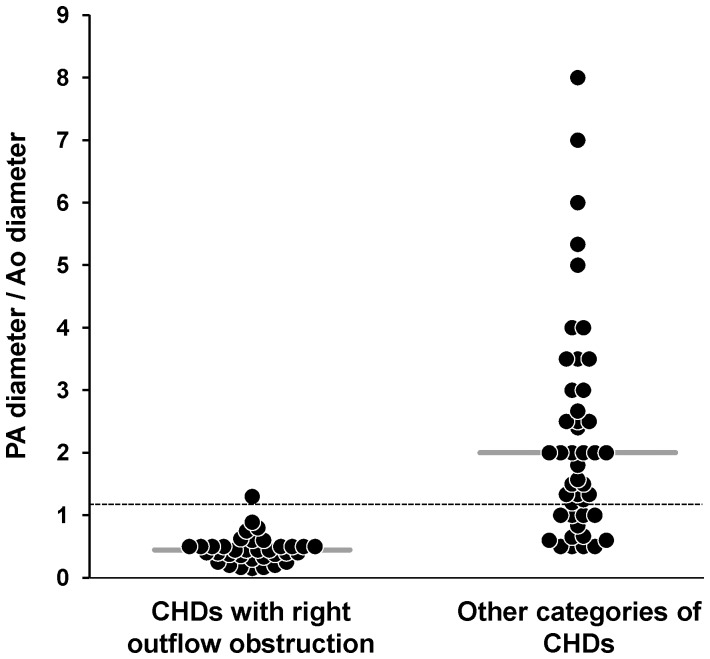
Figure 2. Individual PA/Ao values.
Values were available for 35 fetuses with CHD and right outflow obstruction, and 45 fetuses with CHDs of other types. Horizontal bar: median value in each subgroup. Dashed horizontal line: expected normal AP/Ao value (i.e. 1.2). p<0.0001 for comparisons between subgroups.

