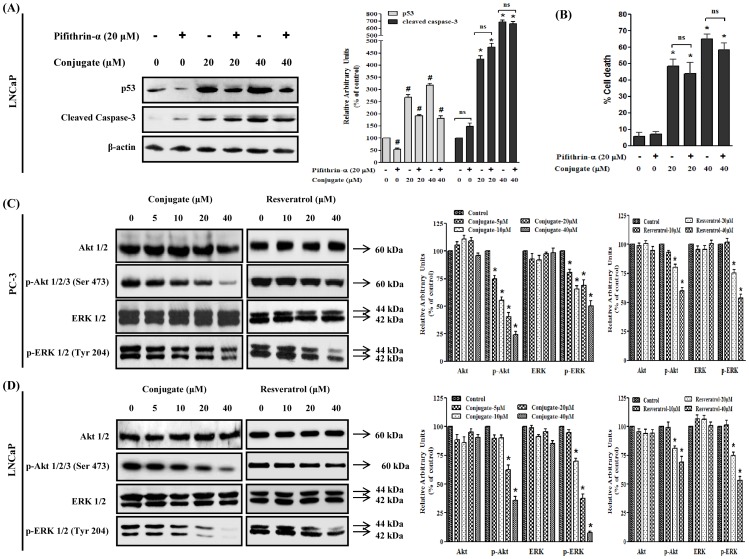
Figure 4. Role of p53 protein on conjugate induced cell death in LNCaP cells.
Effect of p53 inhibitor (PFT-α) on (A) the expression of apoptotic genes as determined by immunoblot analysis and (B) cell death in conjugate treated LNCaP cells as determined by MTT assay. Data are the mean ± SEM of three independent experiments. # and *indicates significant difference with respect to the controls for p53 and caspsase-3 proteins respectively at p<0.05. (C) Immunoblot analysis to show the phosphorylation patterns of Akt and ERK in PC-3 and (D) LNCaP cells in response to varying doses of conjugate and resveratrol treatments. The histogram on the right panel of each figure represents densitometric analyses of the image data and expressed as percent of control where the results are mean ± SEM of three independent experiments. *represents statistically significant difference with respect to control for each group at p<0.05.

