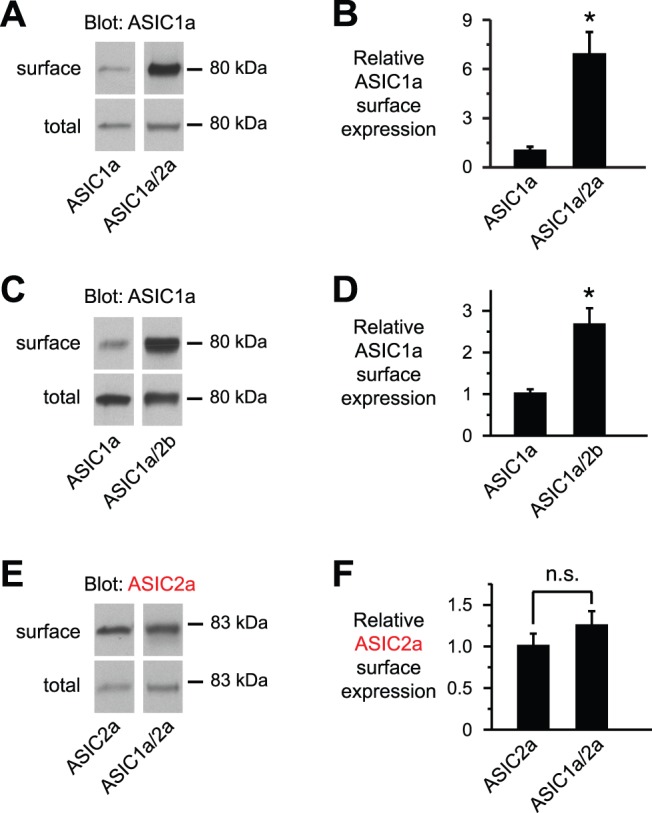
Figure 2. ASIC2 subunits increase ASIC1a cell surface expression.

A, C, and E, Immunoblots (IB) (anti-HA) of biotinylated (surface) and total ASIC1a or -2a in CHO cells transfected with the indicated ASIC subunits (7.5 μg). The immunoblotted ASIC subunit was epitope-tagged with HA to allow detection. DsRed cDNA was added to keep total cDNA constant. Lanes for surface and total protein were from the same gel and film exposures respectively, but were rearranged for clarity. B, D, and F, Indicated ASIC surface expression is quantitated and normalized to the total amount of ASIC in the cell lysate for data from A, C, and E, respectively (n ≥5; *P<0.05; n.s. indicates no significant difference).
