
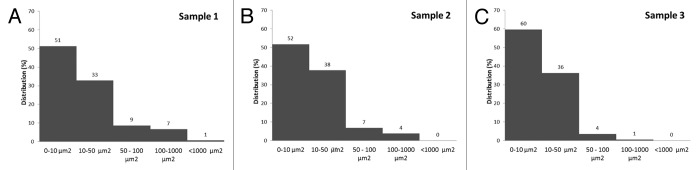
Figure 2. Proportional distribution of pore sizes determined from SEM stereological analysis. Different distributions of pore sizes were seen in the samples. While proportional representations of pores were similar in samples prepared by classic deposition (Sample 1 [A] and Sample 2 [B]), smaller pores predominated in Sample 3 [C]).