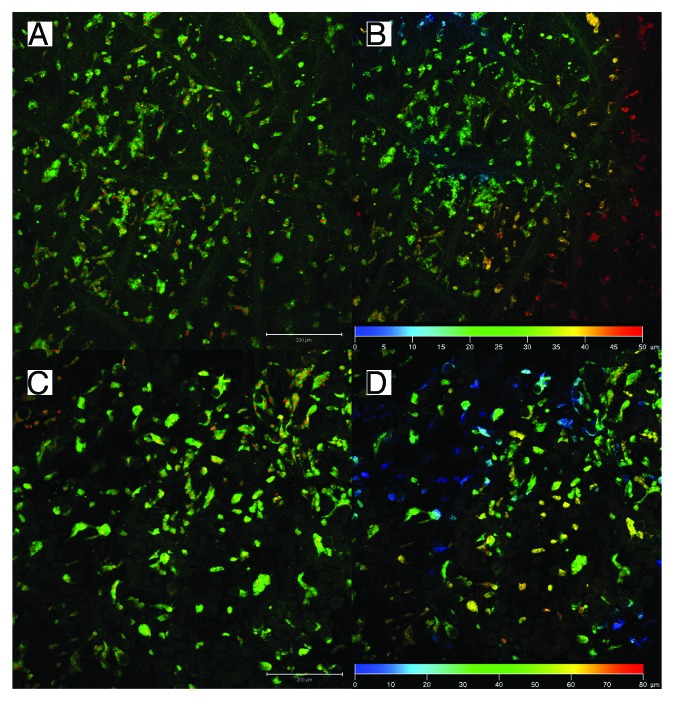
Figure 4. Penetration of mesenchymal stem cells to electrospun nanofibers on day 7. Penetration to non-patterned 2D nanofibers (A and B) and patterned 3D nanofibers (C and D). The micrograph shows in figures A and C MSCs stained with DiOC6 for membranes (green) and propidium iodide for nuclei (red). Figures B and D represents color-coded depth profile of cells on scaffolds.

An official website of the United States government
Here's how you know
Official websites use .gov
A
.gov website belongs to an official
government organization in the United States.
Secure .gov websites use HTTPS
A lock (
) or https:// means you've safely
connected to the .gov website. Share sensitive
information only on official, secure websites.
