
Figure 2.
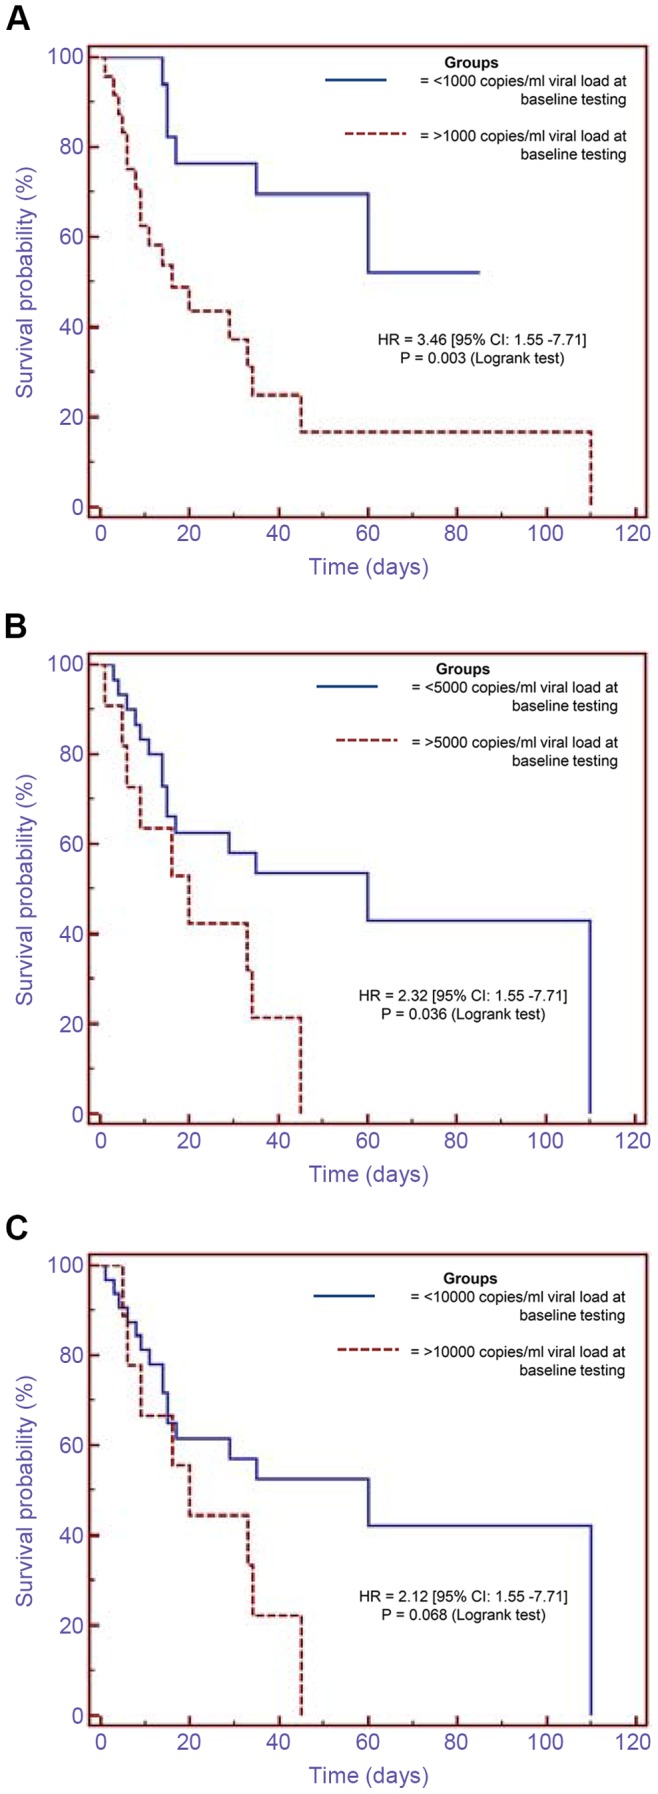
Kaplan-Meier curve analysis showing survival probalities between the groups of patients: (A) who had CMV viral loads <1000 copies/ml compared to those who had viral loads >1000 copies/ml at baseline testing, (B) who had CMV viral loads <5000 copies/ml compared to those who had viral loads >5000 copies/ml at baseline testing, (C) who had CMV viral loads <10000 copies/ml compared to those who had viral loads >10000 copies/ml at baseline testing. HR = hazard ratio, CI = confidence interval.